🧠 Key takeaways
Quality control of scATAC-seq data starts from the fragment file, which records every fragment that the Tn5 transposase cut out of accessible chromatin in each cell.
The number of fragments and the TSS enrichment are the most informative quality metrics. Their thresholds depend on protocol and sequencing depth and should be chosen from their joint distribution.
Simulation-based doublet detection finds doublets of different cell types, and counting positions covered by more than two fragments finds the rest.
⚙️ Environment setup
Install conda:
Before creating the environment, ensure that conda is installed on your system.
Save the yml content:
Copy the content from the yml tab into a file named
environment.yml.
Create the environment:
Open a terminal or command prompt.
Run the following command:
conda env create -f environment.yml
Activate the environment:
After the environment is created, activate it using:
conda activate <environment_name>Replace
<environment_name>with the name specified in theenvironment.ymlfile. In the yml file it will look like this:name: <environment_name>
Verify the installation:
Check that the environment was created successfully by running:
conda env list
name: chromatin-accessibility
channels:
  - conda-forge
dependencies:
  - conda-forge::ipykernel=7.3.0
  - conda-forge::ipywidgets=8.1.9
  - conda-forge::python=3.13.15
  - conda-forge::scanpy=1.12.4
  - pip
  - pip:
      - lamindb==2.10.0
      - macs3==3.0.5
      - muon==0.1.9
      - snapatac2==2.10.0
🗄️ Get data and notebooks
This book uses lamindb to store, share, and load datasets and notebooks using the theislab/sc-best-practices instance. We acknowledge free hosting from Lamin Labs.
Install lamindb
Install the lamindb Python package:
pip install lamindbOptionally create a lamin account
Sign up and log in following the instructions
Verify your setup
Run the
lamin connectcommand:
import lamindb as ln

ln.Artifact.connect("theislab/sc-best-practices").df()
You should now see up to 100 of the stored datasets.
Accessing datasets (Artifacts)
Search for the datasets on the Artifacts page
Load an Artifact and the corresponding object:
import lamindb as ln

af = ln.Artifact.connect("theislab/sc-best-practices").get(
    key="key_of_dataset", is_latest=True
)
obj = af.load()
The object is now accessible in memory and is ready for analysis. Adapt the
lamindb.Artifact.connect("theislab/sc-best-practices").get("SOMEIDXXXX")suffix to get respective versions.Accessing notebooks (Transforms)
Search for the notebook on the Transforms page
Load the notebook:
lamin load <notebook url>which will download the notebook to the current working directory. Analogously to
Artifacts, you can adapt the suffix ID to get older versions.
Motivation
scATAC-seq data are even sparser than scRNA-seq data, since only 1-10% of the open chromatin regions of a cell are detected Chen et al., 2019. Nuclei with few fragments or a poor signal-to-noise ratio therefore add little information, and doublets create profiles that do not exist. Quality control starts from the fragment file, which records every fragment that the Tn5 transposase cut out of accessible chromatin in each cell, and all metrics in this chapter are computed from it.
Dataset
We use about 10,000 peripheral blood mononuclear cells (PBMCs) measured with the 10x Multiome assay, which profiles gene expression and chromatin accessibility in the same nuclei. Cell Ranger ARC aligned the reads, called cells and wrote the fragment file, and we analyse the chromatin accessibility of these cells with SnapATAC2 Zhang et al., 2024. The gene expression is used later for gene regulatory networks.
import logging

import lamindb as ln
import snapatac2 as snap

for name in ("kaleido", "choreographer"):
    logging.getLogger(name).setLevel(logging.WARNING)

ln.connect("theislab/sc-best-practices")

ln.track("IDZANgLhhyWN")
Output
→ connected lamindb: theislab/sc-best-practices
→ loaded Transform('IDZANgLhhyWN0000', key='quality_control.ipynb'), started new Run('d0QqfYHNmP2NZGbA') at 2026-09-29 14:35:58 UTC
→ notebook imports: lamindb-core==2.10.0 snapatac2==2.10.0
We load the cells called by Cell Ranger ARC, their fragment file and the gene annotation of the reference genome from lamindb.
mdata = ln.Artifact.get(
    key="introduction/advanced_data_structures_and_frameworks_muon.h5mu"
).load()
fragments = ln.Artifact.get(
    key="introduction/advanced_data_structures_and_frameworks_atac_fragments.tsv.gz"
).cache()
annotation = ln.Artifact.get(
    key="chromatin_accessibility/gencode_v41_GRCh38.gff3.gz"
).cache()
SnapATAC2 reads the fragments of the called cells into an AnnData object and keeps them in .obsm, so that later steps can count them over any set of genomic regions.
adata = snap.pp.import_fragments(
    fragments,
    chrom_sizes=snap.genome.hg38.chrom_sizes,
    whitelist=mdata["atac"].obs_names.tolist(),
    sorted_by_barcode=False,
)
adata
AnnData object with n_obs × n_vars = 11874 × 0
obs: 'n_fragment', 'frac_dup', 'frac_mito'
uns: 'reference_sequences'
obsm: 'fragment_paired'Quality metrics
Fragment size distribution
Tn5 cuts between nucleosomes, so fragment sizes cluster into a nucleosome-free peak below 147 bp and peaks for fragments spanning one or more nucleosomes at multiples of about 200 bp. A clear periodic pattern indicates that the nuclei were intact and the transposition worked.
snap.metrics.frag_size_distr(adata)
snap.pl.frag_size_distr(adata, interactive=False)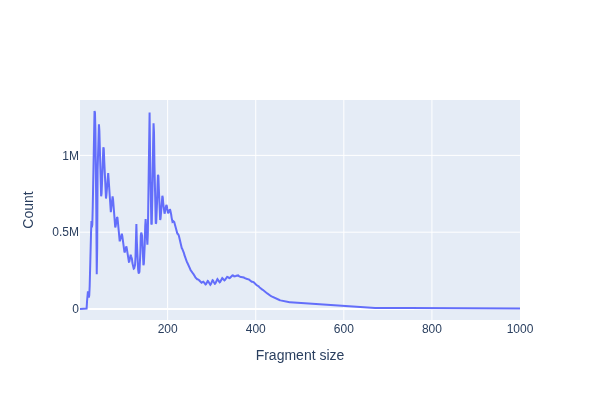
TSS enrichment
Transcription start sites (TSSs) of active genes are among the most accessible regions of the genome. The TSS enrichment score compares the fragments at TSSs with those in their flanks and measures the signal-to-noise ratio of each cell. It correlates strongly with the fraction of fragments in peaks and can therefore be used before any peaks are called De Rop et al., 2024. Its absolute value depends on the set of TSSs and on the tool, so thresholds from other pipelines do not transfer directly.
snap.metrics.tsse(adata, annotation)
snap.pl.tsse(adata, interactive=False)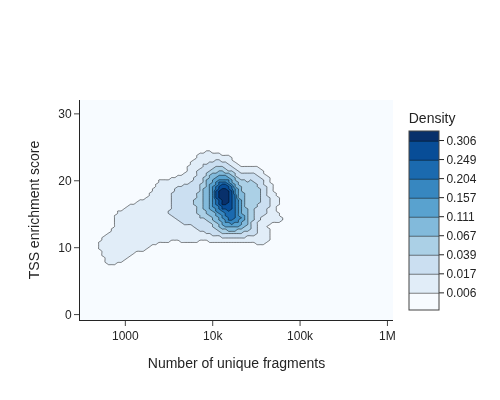
Filtering cells
The number of fragments and the TSS enrichment are the most informative quality metrics, and the number of fragments also predicts how well doublet detection and annotation work downstream De Rop et al., 2024. There are no universal thresholds, since both depend on the protocol and the sequencing depth, so we choose them from the joint distribution above. We keep cells with 5,000 to 100,000 fragments and a TSS enrichment of at least 10, which removes the low-quality cells in the lower left of the plot and cells with unusually many fragments.
snap.pp.filter_cells(adata, min_counts=5000, max_counts=100000, min_tsse=10)
adata
AnnData object with n_obs × n_vars = 10255 × 0
obs: 'n_fragment', 'frac_dup', 'frac_mito', 'tsse'
uns: 'reference_sequences', 'frag_size_distr', 'library_tsse', 'frac_overlap_TSS', 'TSS_profile'
obsm: 'fragment_paired'Doublet detection
SnapATAC2 detects doublets like Scrublet Wolock et al., 2019: it simulates doublets by combining random pairs of cells and scores every cell by the fraction of simulated doublets among its neighbors. This requires a cell-by-feature matrix, for which we count fragments in 500 bp tiles across the genome and select the most informative tiles, as explained in the next chapter. Simulated doublets only resemble doublets of different cell types, which AMULET complements by counting genomic positions covered by more than two fragments, which is impossible in a single diploid nucleus Thibodeau et al., 2021. Combining both approaches detects doublets most reliably Germain et al., 2022, and for multiome data, doublets can also be detected in the gene expression.
snap.pp.add_tile_matrix(adata)
snap.pp.select_features(adata, n_features=250000)
snap.pp.scrublet(adata)
snap.pp.filter_doublets(adata)
adata
2026-09-29 16:39:52 - INFO - Selected 250000 features.
2026-09-29 16:39:54 - INFO - Simulating doublets...
2026-09-29 16:39:55 - INFO - Spectral embedding ...
2026-09-29 16:41:11 - INFO - Calculating doublet scores...
2026-09-29 16:41:15 - INFO - Detected doublet rate = 9.751%
AnnData object with n_obs × n_vars = 9255 × 6062095
    obs: 'n_fragment', 'frac_dup', 'frac_mito', 'tsse', 'doublet_probability', 'doublet_score'
    var: 'count', 'selected'
    uns: 'reference_sequences', 'frag_size_distr', 'library_tsse', 'frac_overlap_TSS', 'TSS_profile', 'scrublet_sim_doublet_score', 'doublet_rate'
    obsm: 'fragment_paired'
    layers: None (.X)
We store the filtered cells, their fragments and the tile matrix for the next chapters.
ln.Artifact.from_anndata(
    adata,
    key="chromatin_accessibility/pbmc10k_quality_control.h5ad",
    description="PBMC 10k multiome chromatin accessibility after quality control",
).save()
Output
→ returning artifact with same hash: Artifact(uid='vjLsMVvt3HDiKri00000', key='chromatin_accessibility/pbmc10k_quality_control.h5ad', description='PBMC 10k multiome chromatin accessibility after quality control', suffix='.h5ad', kind='dataset', otype='AnnData', size=3261630727, hash='19FCxRDmDoMxNJMlRHyJ_L', n_files=None, n_observations=9255, extra_data=None, branch_id=1, created_on_id=1, space_id=1, storage_id=1, run_id=162, schema_id=None, created_by_id=2, created_at=2026-09-29 14:32:49 UTC, is_locked=False, version_tag=None, is_latest=True); to track this artifact as an input, use: ln.Artifact.get()
Artifact(uid='vjLsMVvt3HDiKri00000', key='chromatin_accessibility/pbmc10k_quality_control.h5ad', description='PBMC 10k multiome chromatin accessibility after quality control', suffix='.h5ad', kind='dataset', otype='AnnData', size=3261630727, hash='19FCxRDmDoMxNJMlRHyJ_L', n_files=None, n_observations=9255, extra_data=None, branch_id=1, created_on_id=1, space_id=1, storage_id=1, run_id=162, schema_id=None, created_by_id=2, created_at=2026-09-29 14:32:49 UTC, is_locked=False, version_tag=None, is_latest=True)Contributors
We gratefully acknowledge the contributions of:
Authors
Christopher Lance
Laura Martens
Reviewers
Lukas Heumos
Anna Schaar
- Chen, H., Lareau, C., Andreani, T., Vinyard, M. E., Garcia, S. P., Clement, K., Andrade-Navarro, M. A., Buenrostro, J. D., & Pinello, L. (2019). Assessment of computational methods for the analysis of single-cell ATAC-seq data. Genome Biology, 20(1), 241. 10.1186/s13059-019-1854-5
- Zhang, K., Zemke, N. R., Armand, E. J., & Ren, B. (2024). A fast, scalable and versatile tool for analysis of single-cell omics data. Nature Methods, 21(2), 217–227. 10.1038/s41592-023-02139-9
- De Rop, F. V., Hulselmans, G., Flerin, C., Soler-Vila, P., Rafels, A., Christiaens, V., González-Blas, C. B., Marchese, D., Caratù, G., Poovathingal, S., Rozenblatt-Rosen, O., Slyper, M., Luo, W., Muus, C., Duarte, F., Shrestha, R., Bagdatli, S. T., Corces, M. R., Mamanova, L., … Heyn, H. (2024). Systematic benchmarking of single-cell ATAC-sequencing protocols. Nature Biotechnology, 42(6), 916–926. 10.1038/s41587-023-01881-x
- Wolock, S. L., Lopez, R., & Klein, A. M. (2019). Scrublet: Computational Identification of Cell Doublets in Single-Cell Transcriptomic Data. Cell Systems, 8(4), 281-291.e9. 10.1016/j.cels.2018.11.005
- Thibodeau, A., Eroglu, A., McGinnis, C. S., Lawlor, N., Nehar-Belaid, D., Kursawe, R., Marches, R., Conrad, D. N., Kuchel, G. A., Gartner, Z. J., Banchereau, J., Stitzel, M. L., Cicek, A. E., & Ucar, D. (2021). AMULET: a novel read count-based method for effective multiplet detection from single nucleus ATAC-seq data. Genome Biology, 22(1), 252. 10.1186/s13059-021-02469-x
- Germain, P.-L., Lun, A., Garcia Meixide, C., Macnair, W., & Robinson, M. D. (2022). Doublet identification in single-cell sequencing data using scDblFinder. F1000Research, 10, 979. 10.12688/f1000research.73600.2