🧠 Key takeaways
Pooled CRISPR screens with single-cell readouts measure the transcriptional effects of many genetic perturbations in one experiment, starting from the assignment of guides to cells.
Perturbations fail in many cells, so perturbed cells should be identified, for example with Mixscape, and differential expression should be tested on pseudobulks of replicates.
The E-distance and E-test quantify and test the effect of each perturbation, and clustering perturbations by their effects recovers complexes and pathways.
⚙️ Environment setup
Install conda:
Before creating the environment, ensure that conda is installed on your system.
Save the yml content:
Copy the content from the yml tab into a file named
environment.yml.
Create the environment:
Open a terminal or command prompt.
Run the following command:
conda env create -f environment.yml
Activate the environment:
After the environment is created, activate it using:
conda activate <environment_name>Replace
<environment_name>with the name specified in theenvironment.ymlfile. In the yml file it will look like this:name: <environment_name>
Verify the installation:
Check that the environment was created successfully by running:
conda env list
name: perturbation-modeling
channels:
  - conda-forge
dependencies:
  - conda-forge::ipykernel=7.3.0
  - conda-forge::ipywidgets=8.1.9
  - conda-forge::python-igraph=1.0.0
  - conda-forge::python=3.13.15
  - conda-forge::scanpy=1.12.4
  - pip
  - pip:
      - lamindb==2.10.0
      - pertpy[de]==1.3.0
🗄️ Get data and notebooks
This book uses lamindb to store, share, and load datasets and notebooks using the theislab/sc-best-practices instance. We acknowledge free hosting from Lamin Labs.
Install lamindb
Install the lamindb Python package:
pip install lamindbOptionally create a lamin account
Sign up and log in following the instructions
Verify your setup
Run the
lamin connectcommand:
import lamindb as ln

ln.Artifact.connect("theislab/sc-best-practices").df()
You should now see up to 100 of the stored datasets.
Accessing datasets (Artifacts)
Search for the datasets on the Artifacts page
Load an Artifact and the corresponding object:
import lamindb as ln

af = ln.Artifact.connect("theislab/sc-best-practices").get(
    key="key_of_dataset", is_latest=True
)
obj = af.load()
The object is now accessible in memory and is ready for analysis. Adapt the
lamindb.Artifact.connect("theislab/sc-best-practices").get("SOMEIDXXXX")suffix to get respective versions.Accessing notebooks (Transforms)
Search for the notebook on the Transforms page
Load the notebook:
lamin load <notebook url>which will download the notebook to the current working directory. Analogously to
Artifacts, you can adapt the suffix ID to get older versions.
Motivation
Perturbation screens measure how cells respond when a gene or a pathway is disrupted. Pooled CRISPR screens with single-cell readouts such as Perturb-seq and CROP-seq introduce one guide RNA per cell, sequence the guide together with the transcriptome, and thereby measure the effect of hundreds to thousands of genetic perturbations in a single experiment Dixit et al., 2016Adamson et al., 2016Datlinger et al., 2017. Genome-scale screens now cover every expressed gene Replogle et al., 2022, and similar designs measure the effects of chemical compounds at several doses Srivatsan et al., 2020.
The analysis of such screens follows a common path: assign guides to cells, identify the cells in which the perturbation worked, quantify and test the effect of each perturbation, find the genes it affects, and group perturbations with similar effects. We follow this path with pertpy Heumos et al., 2026 on two screens, a multimodal screen of immune checkpoint regulators and a genome-scale screen of essential genes.
import warnings

import lamindb as ln
import numpy as np
import pandas as pd
import pertpy as pt
import scanpy as sc

warnings.filterwarnings("ignore", category=FutureWarning)
warnings.filterwarnings("ignore", message="var_names are not unique")
warnings.filterwarnings("ignore", message="As the residual degrees of freedom")

ln.connect("theislab/sc-best-practices")

ln.track("ABrLmpTovdzk")
Output
→ connected lamindb: theislab/sc-best-practices
! It looks like you are running jupyter lab but don't have jupyter-server module installed. Please install it via pip install jupyter-server
→ loaded Transform('ABrLmpTovdzk0000', key='perturbation_modeling.ipynb'), started new Run('sP7tADr5CHcJqFWW') at 2026-09-30 12:49:11 UTC
→ notebook imports: lamindb-core==2.10.0 numpy==2.5.3 pandas==3.0.6 pertpy==1.3.0 scanpy==1.12.4
Dataset
Papalexi et al. targeted 26 genes that regulate the immune checkpoint PD-L1 in THP-1 cells with 111 guide RNAs and three biological replicates Papalexi et al., 2021. Their ECCITE-seq protocol measures the transcriptome, four surface proteins including PD-L1, hashtags for sample multiplexing and the guide RNAs of every cell.
mdata = ln.Artifact.get(
    key="conditions/perturbation_modeling/papalexi_2021.h5mu"
).load()
mdata
MuData object with n_obs × n_vars = 20729 × 18776
obs: 'MULTI_ID', 'HTO_classification', 'guide_ID', 'gene_target', 'NT', 'perturbation', 'replicate', 'S.Score', 'G2M.Score', 'phase'
var: 'name'
4 modalities
rna: 20729 × 18649
obs: 'nCount_RNA', 'nFeature_RNA', 'percent.mito'
var: 'name'
layers: None
adt: 20729 × 4
obs: 'nCount_ADT', 'nFeature_ADT'
var: 'name'
layers: None
hto: 20729 × 12
obs: 'nCount_HTO', 'nFeature_HTO', 'technique'
var: 'name'
layers: None
gdo: 20729 × 111
obs: 'nCount_GDO'
var: 'name'
layers: NoneAssigning guides
Every downstream result depends on knowing which guide a cell received. The guide counts are noisy, since ambient guide RNA is captured in every droplet, so we assign a cell the guide with the most counts only if it has at least five of them Braunger & Velten, 2024.
gdo = mdata["gdo"]
gdo.layers["counts"] = gdo.X.copy()
guides = pt.pp.GuideAssignment()
guides.assign_to_max_guide(gdo, assignment_threshold=5, layer="counts")
gdo.obs["assigned_guide"].value_counts().head()
assigned_guide
IFNGR2g1 579
ATF2g1 500
NTg7 445
NTg4 431
IFNGR1g3 416
Name: count, dtype: int64Each guide is carried by a few hundred cells, and cells whose most abundant guide has fewer than five counts remain unassigned.
(gdo.obs["assigned_guide"].astype(str) == mdata.obs["guide_ID"].astype(str)).mean()np.float64(1.0)Our assignment agrees with the one published by the authors for every cell.
Identifying perturbed cells
CRISPR edits do not succeed in every cell, so many cells that received a targeting guide still express their target normally, and their inclusion dilutes the measured effects. Mixscape first removes technical and biological variation that is shared with the control cells of the same replicate by subtracting the mean expression of each cell’s nearest control neighbors. It then classifies every targeted cell as perturbed (KO) or not perturbed (NP) with a mixture model on this perturbation signature Papalexi et al., 2021.
rna = mdata["rna"].copy()
rna.obs = mdata.obs[["guide_ID", "gene_target", "perturbation", "replicate"]].copy()
rna.layers["counts"] = rna.X.copy()
sc.pp.normalize_total(rna)
sc.pp.log1p(rna)
sc.pp.highly_variable_genes(rna, n_top_genes=2000, subset=True)
sc.pp.pca(rna)
mixscape = pt.tl.Mixscape()
mixscape.perturbation_signature(
    rna, pert_key="perturbation", control="NT", split_by="replicate", n_neighbors=20
)
mixscape.mixscape(rna, pert_key="gene_target", control="NT", layer="X_pert")
Output
rna.obs.groupby("gene_target", observed=True)["mixscape_class_global"].value_counts(
    normalize=True
).unstack().sort_values("KO", ascending=False).head(10)Mixscape detects a perturbation in about three quarters of the cells targeting JAK2, SMAD4, STAT1, IFNGR1 and IFNGR2, whereas most cells targeting other genes are classified as not perturbed. For those genes, either the knockout failed or it does not change the transcriptome of THP-1 cells, which the classification cannot distinguish.
The surface protein measurements provide an independent check. Knocking out the interferon-γ receptor or its downstream signaling should reduce PD-L1, whose expression THP-1 cells induce in response to interferon-γ.
adt = mdata["adt"].copy()
sc.pp.normalize_total(adt)
sc.pp.log1p(adt)
rna.obs["PD-L1"] = adt[rna.obs_names, "PDL1"].X.toarray().ravel()
classes = ["NT", "IFNGR2 NP", "IFNGR2 KO", "JAK2 NP", "JAK2 KO", "STAT1 NP", "STAT1 KO"]
sc.pl.violin(
    rna[rna.obs["mixscape_class"].isin(classes)].copy(),
    "PD-L1",
    groupby="mixscape_class",
    order=classes,
    rotation=45,
)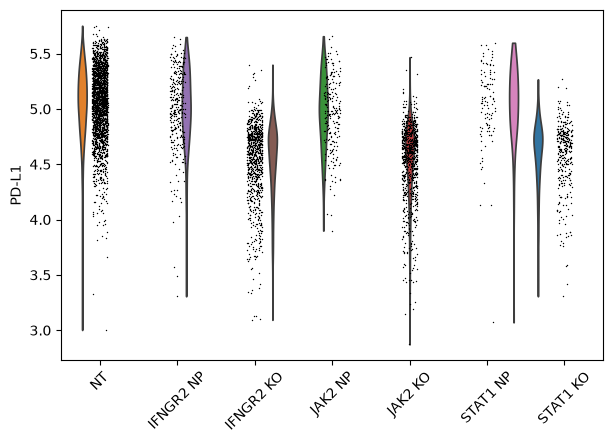
PD-L1 is lower in the knockout cells of IFNGR2, JAK2 and STAT1 than in the control cells and in the cells classified as not perturbed, which confirms the classification with an independent measurement.
Mixscale extends this approach with a continuous score of perturbation strength per cell, which retains cells with partial effects Jiang et al., 2025.
Differential expression per perturbation
To find the genes affected by a perturbation, we compare the perturbed cells with the control cells. Cells of the same replicate are not independent samples, so we sum the counts of each group per replicate and test the resulting pseudobulks with PyDESeq2, as described in the differential gene expression chapter Squair et al., 2021. We compare the cells in which IFNGR2 was knocked out with the control cells.
counts = mdata["rna"][rna.obs_names].copy()
counts.obs = rna.obs[["mixscape_class", "replicate"]].copy()
counts = counts[counts.obs["mixscape_class"].isin(["NT", "IFNGR2 KO"])].copy()
pseudobulk = pt.tl.PseudobulkSpace().compute(
    counts, target_col="mixscape_class", groups_col="replicate", mode="sum"
)
pds2 = pt.tl.PyDESeq2(adata=pseudobulk, design="~ replicate + mixscape_class")
pds2.fit()
results = pds2.test_contrasts(
    pds2.contrast(column="mixscape_class", baseline="NT", group_to_compare="IFNGR2 KO")
)
Output
Using None as control genes, passed at DeseqDataSet initialization
Fitting size factors...
... done in 0.00 seconds.
Fitting dispersions...
... done in 0.94 seconds.

Fitting dispersion trend curve...
... done in 0.23 seconds.

Fitting MAP dispersions...
... done in 1.02 seconds.

Fitting LFCs...
... done in 1.15 seconds.

Calculating cook's distance...
... done in 0.00 seconds.

Replacing 0 outlier genes.

Running Wald tests...
Log2 fold change & Wald test p-value, contrast vector: [ 0.  0.  0. -1.]
                baseMean  log2FoldChange     lfcSE      stat    pvalue  \
index
AL627309.1      3.567120       -2.751477  1.470535 -1.871072  0.061335
AP006222.2     32.087337        0.334094  0.378640  0.882354  0.377586
RP4-669L17.10   2.454185        0.173563  1.332640  0.130240  0.896377
RP11-206L10.3   6.113561       -0.344735  0.857671 -0.401943  0.687726
RP11-206L10.2  16.437865        0.835091  0.534201  1.563252  0.117993
...                  ...             ...       ...       ...       ...
L3MBTL4         0.000000             NaN       NaN       NaN       NaN
CTB-31O20.9     0.215351       -0.356789  4.360549 -0.081822  0.934788
AC092295.4      0.112910        0.441008  4.463447  0.098804  0.921294
MYO18B          0.307379        2.212641  4.396574  0.503265  0.614778
TMPRSS3         0.204883        0.017122  4.437498  0.003858  0.996921

                   padj
index
AL627309.1          NaN
AP006222.2     0.681090
RP4-669L17.10       NaN
RP11-206L10.3  0.881118
RP11-206L10.2  0.356098
...                 ...
L3MBTL4             NaN
CTB-31O20.9         NaN
AC092295.4          NaN
MYO18B              NaN
TMPRSS3             NaN

[18649 rows x 6 columns]
... done in 0.80 seconds.
pds2.plot_volcano(results, log2fc_threshold=1)NaNs encountered, dropping rows with NaNs
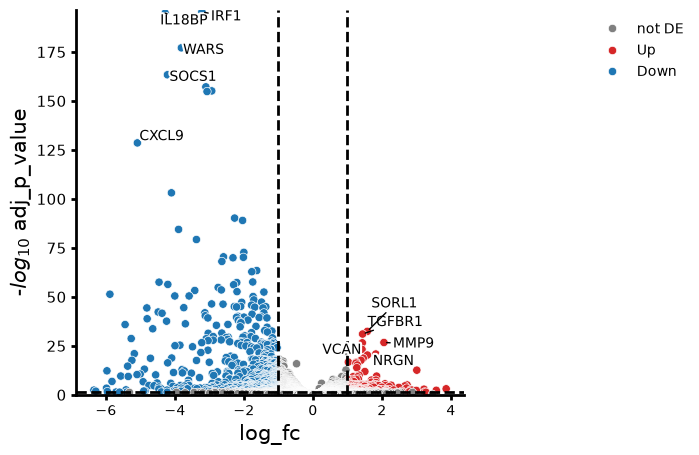
Knocking out IFNGR2 reduces interferon-γ response genes such as IRF1, SOCS1, CXCL9 and IL18BP, as expected from the loss of interferon-γ signaling. With three replicates per group, the dispersion estimates of PyDESeq2 rest on few degrees of freedom, so more replicates would make the results more robust.
Comparing perturbations at scale
Genome-scale screens raise questions about the perturbations themselves: which of them change the transcriptome at all, and which act alike. Replogle et al. knocked down every essential gene in K562 cells with CRISPR interference Replogle et al., 2022. We use at most 50 cells per perturbation and all control cells.
adata = ln.Artifact.get(
    key="conditions/perturbation_modeling/replogle_2022_k562_essential.h5ad"
).load()
sc.pp.normalize_total(adata)
sc.pp.log1p(adata)
sc.pp.highly_variable_genes(adata, n_top_genes=2000, subset=True)
sc.pp.pca(adata, n_comps=50)
adata
AnnData object with n_obs × n_vars = 109565 × 2000
obs: 'batch', 'gene', 'gene_id', 'transcript', 'gene_transcript', 'guide_id', 'percent_mito', 'UMI_count', 'z_gemgroup_UMI', 'core_scale_factor', 'core_adjusted_UMI_count', 'disease', 'cancer', 'cell_line', 'sex', 'age', 'perturbation', 'organism', 'perturbation_type', 'tissue_type', 'ncounts', 'ngenes', 'nperts', 'percent_ribo'
var: 'chr', 'start', 'end', 'class', 'strand', 'length', 'in_matrix', 'mean', 'std', 'cv', 'fano', 'ensembl_id', 'ncounts', 'ncells', 'highly_variable', 'means', 'dispersions', 'dispersions_norm'
uns: 'log1p', 'hvg', 'pca'
obsm: 'X_pca'
varm: 'PCs'
layers: None (.X)Effect size
The energy distance (E-distance) compares the distribution of perturbed cells with that of control cells in a low-dimensional space, relative to the spread within each group Peidli et al., 2024. It is zero if both groups are indistinguishable and grows with the strength of the perturbation.
distance = pt.tl.Distance("edistance", obsm_key="X_pca")
edistances = (
    distance.onesided_distances(
        adata, groupby="perturbation", selected_group="control", show_progressbar=False
    )
    .drop("control")
    .sort_values(ascending=False)
)
edistances.head(10)
perturbation
GATA1 7.643471
HSPA9 7.529457
EIF2S1 7.038001
AQR 6.883053
SNRPD2 6.600380
PHB 6.351600
MED30 6.015050
EP400 5.454351
CHMP3 5.395464
INTS2 5.348413
Name: edistance to control, dtype: float64The strongest effects come from knocking down GATA1, the master regulator of the erythroid program of K562 cells, and core components of protein folding, translation, splicing and the Mediator complex.
The E-test assesses whether a perturbation differs from the controls by comparing its E-distance with those obtained after permuting the labels. Since each test requires many permutations, we test a selection of the strongest and of random perturbations against a subsample of the controls.
rng = np.random.default_rng(0)
tested = list(edistances.index[:10]) + list(
    rng.choice(edistances.index[10:], 10, replace=False)
)
controls = adata.obs_names[adata.obs["perturbation"] == "control"]
cells = adata.obs_names[adata.obs["perturbation"].isin(tested)].append(
    pd.Index(rng.choice(controls, 1000, replace=False))
)
etest = pt.tl.DistanceTest("edistance", n_perms=1000, obsm_key="X_pca")
etest_results = etest(
    adata[cells].copy(),
    groupby="perturbation",
    contrast="control",
    show_progressbar=False,
)
etest_results.sort_values("distance", ascending=False)All ten strong perturbations and seven of the ten random ones differ significantly from the controls after correcting for multiple testing. Many knockdowns of essential genes change the transcriptome only subtly, which the E-test detects even for small E-distances.
Perturbations with similar effects
Perturbations of genes in the same complex or pathway cause similar transcriptional changes. We summarize each of the strongest perturbations by the mean of its cells in the PCA space, cluster these profiles, and list the genes in each cluster.
strong = adata[adata.obs["perturbation"].isin(edistances.index[:200])].copy()
profiles = pt.tl.PseudobulkSpace().compute(
    strong, target_col="perturbation", embedding_key="X_pca", mode="mean"
)
sc.pp.neighbors(profiles, use_rep="X", n_neighbors=5)
sc.tl.leiden(profiles, resolution=2, flavor="igraph", n_iterations=2)
pd.set_option("display.max_colwidth", None)
profiles.obs.groupby("leiden", observed=True).apply(
    lambda group: ", ".join(group.index)
).to_frame("perturbations")The clusters recover known complexes and pathways, such as the large and small ribosomal subunits, the spliceosome, the RNA exosome, the proteasome, the Mediator, Integrator and PAF1 complexes, and aminoacyl-tRNA synthetases together with eIF2B, whose loss activates the integrated stress response Replogle et al., 2022. Grouping perturbations by their effects therefore assigns functions to poorly characterized genes that cluster with known complexes.
Predicting unseen perturbations
Many models aim to predict the transcriptional response to perturbations that were never measured, from variational autoencoders such as scGen Lotfollahi et al., 2019 to foundation models trained on millions of cells. Independent benchmarks found that none of these models consistently outperformed simple baselines such as the mean response of all training perturbations or linear models Ahlmann-Eltze et al., 2025Csendes et al., 2025Kernfeld et al., 2025Wei et al., 2026. Common evaluation metrics also reward models for reproducing the systematic difference between perturbed and control cells rather than perturbation-specific effects Viñas Torné et al., 2026. Predictions should therefore be compared with such baselines before they are used to prioritize experiments.
Quiz
Contributors
We gratefully acknowledge the contributions of:
Authors
Lukas Heumos
Mohammad Lotfollahi
Reviewers
Yuge Ji
- Dixit, A., Parnas, O., Li, B., Chen, J., Fulco, C. P., Jerby-Arnon, L., Marjanovic, N. D., Dionne, D., Burks, T., Raychowdhury, R., Adamson, B., Norman, T. M., Lander, E. S., Weissman, J. S., Friedman, N., & Regev, A. (2016). Perturb-Seq: Dissecting Molecular Circuits with Scalable Single-Cell RNA Profiling of Pooled Genetic Screens. Cell, 167(7), 1853-1866.e17. 10.1016/j.cell.2016.11.038
- Adamson, B., Norman, T. M., Jost, M., Cho, M. Y., Nuñez, J. K., Chen, Y., Villalta, J. E., Gilbert, L. A., Horlbeck, M. A., Hein, M. Y., Pak, R. A., Gray, A. N., Gross, C. A., Dixit, A., Parnas, O., Regev, A., & Weissman, J. S. (2016). A Multiplexed Single-Cell CRISPR Screening Platform Enables Systematic Dissection of the Unfolded Protein Response. Cell, 167(7), 1867-1882.e21. 10.1016/j.cell.2016.11.048
- Datlinger, P., Rendeiro, A. F., Schmidl, C., Krausgruber, T., Traxler, P., Klughammer, J., Schuster, L. C., Kuchler, A., Alpar, D., & Bock, C. (2017). Pooled CRISPR screening with single-cell transcriptome readout. Nature Methods, 14(3), 297–301. 10.1038/nmeth.4177
- Replogle, J. M., Saunders, R. A., Pogson, A. N., Hussmann, J. A., Lenail, A., Guna, A., Mascibroda, L., Wagner, E. J., Adelman, K., Lithwick-Yanai, G., Iremadze, N., Oberstrass, F., Lipson, D., Bonnar, J. L., Jost, M., Norman, T. M., & Weissman, J. S. (2022). Mapping information-rich genotype-phenotype landscapes with genome-scale Perturb-seq. Cell, 185(14), 2559-2575.e28. 10.1016/j.cell.2022.05.013
- Srivatsan, S. R., McFaline-Figueroa, J. L., Ramani, V., Saunders, L., Cao, J., Packer, J., Pliner, H. A., Jackson, D. L., Daza, R. M., Christiansen, L., Zhang, F., Steemers, F., Shendure, J., & Trapnell, C. (2020). Massively multiplex chemical transcriptomics at single-cell resolution. Science, 367(6473), 45–51. 10.1126/science.aax6234
- Heumos, L., Ji, Y., May, L., Green, T. D., Peidli, S., Zhang, X., Wu, X., Ostner, J., Schumacher, A., Hrovatin, K., Müller, M., Chong, F., Sturm, G., Tejada, A., Dann, E., Dong, M., Pinto, G., Bahrami, M., Gold, I., … Theis, F. J. (2026). Pertpy: an end-to-end framework for perturbation analysis. Nature Methods, 23(2), 350–359. 10.1038/s41592-025-02909-7
- Papalexi, E., Mimitou, E. P., Butler, A. W., Foster, S., Bracken, B., Mauck, W. M., Wessels, H.-H., Hao, Y., Yeung, B. Z., Smibert, P., & Satija, R. (2021). Characterizing the molecular regulation of inhibitory immune checkpoints with multimodal single-cell screens. Nature Genetics, 53(3), 322–331. 10.1038/s41588-021-00778-2
- Braunger, J. M., & Velten, B. (2024). Guide assignment in single-cell CRISPR screens using crispat. Bioinformatics, 40(9), btae535. 10.1093/bioinformatics/btae535
- Jiang, L., Dalgarno, C., Papalexi, E., Mascio, I., Wessels, H.-H., Yun, H., Iremadze, N., Lithwick-Yanai, G., Lipson, D., & Satija, R. (2025). Systematic reconstruction of molecular pathway signatures using scalable single-cell perturbation screens. Nature Cell Biology, 27(3), 505–517. 10.1038/s41556-025-01622-z
- Squair, J. W., Gautier, M., Kathe, C., Anderson, M. A., James, N. D., Hutson, T. H., Hudelle, R., Qaiser, T., Matson, K. J. E., Barraud, Q., Levine, A. J., La Manno, G., Skinnider, M. A., & Courtine, G. (2021). Confronting false discoveries in single-cell differential expression. Nature Communications, 12(1), 5692. 10.1038/s41467-021-25960-2
- Peidli, S., Green, T. D., Shen, C., Gross, T., Min, J., Garda, S., Yuan, B., Schumacher, L. J., Taylor-King, J. P., Marks, D. S., Luna, A., Blüthgen, N., & Sander, C. (2024). scPerturb: harmonized single-cell perturbation data. Nature Methods, 21(3), 531–540. 10.1038/s41592-023-02144-y
- Lotfollahi, M., Wolf, F. A., & Theis, F. J. (2019). scGen predicts single-cell perturbation responses. Nature Methods, 16(8), 715–721. 10.1038/s41592-019-0494-8
- Ahlmann-Eltze, C., Huber, W., & Anders, S. (2025). Deep-learning-based gene perturbation effect prediction does not yet outperform simple linear baselines. Nature Methods, 22(8), 1657–1661. 10.1038/s41592-025-02772-6
- Csendes, G., Sanz, G., Szalay, K. Z., & Szalai, B. (2025). Benchmarking foundation cell models for post-perturbation RNA-seq prediction. BMC Genomics, 26(1), 393. 10.1186/s12864-025-11600-2
- Kernfeld, E., Yang, Y., Weinstock, J. S., Battle, A., & Cahan, P. (2025). A comparison of computational methods for expression forecasting. Genome Biology, 26(1), 388. 10.1186/s13059-025-03840-y