🧠 Key takeaways
Gene regulatory networks describe which transcription factors activate or repress which target genes, and the targets of a transcription factor form its regulon.
Networks inferred from expression alone recover few known interactions, so estimating transcription factor activities from a prior-knowledge network such as CollecTRI is the more robust default.
⚙️ Environment setup
Install conda:
Before creating the environment, ensure that conda is installed on your system.
Save the yml content:
Copy the content from the yml tab into a file named
environment.yml.
Create the environment:
Open a terminal or command prompt.
Run the following command:
conda env create -f environment.yml
Activate the environment:
After the environment is created, activate it using:
conda activate <environment_name>Replace
<environment_name>with the name specified in theenvironment.ymlfile. In the yml file it will look like this:name: <environment_name>
Verify the installation:
Check that the environment was created successfully by running:
conda env list
name: gene-regulatory-networks
channels:
  - conda-forge
dependencies:
  - conda-forge::python=3.13.15
  - conda-forge::ipykernel=7.3.0
  - conda-forge::ipywidgets=8.1.9
  - conda-forge::python-igraph=1.0.0
  - conda-forge::scanpy=1.12.4
  - pip
  - pip:
      - decoupler==2.2.0
      - lamindb==2.10.0
🗄️ Get data and notebooks
This book uses lamindb to store, share, and load datasets and notebooks using the theislab/sc-best-practices instance. We acknowledge free hosting from Lamin Labs.
Install lamindb
Install the lamindb Python package:
pip install lamindbOptionally create a lamin account
Sign up and log in following the instructions
Verify your setup
Run the
lamin connectcommand:
import lamindb as ln

ln.Artifact.connect("theislab/sc-best-practices").df()
You should now see up to 100 of the stored datasets.
Accessing datasets (Artifacts)
Search for the datasets on the Artifacts page
Load an Artifact and the corresponding object:
import lamindb as ln

af = ln.Artifact.connect("theislab/sc-best-practices").get(
    key="key_of_dataset", is_latest=True
)
obj = af.load()
The object is now accessible in memory and is ready for analysis. Adapt the
lamindb.Artifact.connect("theislab/sc-best-practices").get("SOMEIDXXXX")suffix to get respective versions.Accessing notebooks (Transforms)
Search for the notebook on the Transforms page
Load the notebook:
lamin load <notebook url>which will download the notebook to the current working directory. Analogously to
Artifacts, you can adapt the suffix ID to get older versions.
Motivation
Transcription factors (TFs) control gene expression by binding regulatory elements near their target genes and activating or repressing their transcription. A gene regulatory network (GRN) describes these relationships as a directed graph from TFs to their target genes, where each edge can carry a sign for activation or repression and a weight. The set of targets of a TF is called its regulon. GRNs help to explain which regulators establish and maintain cell identities and which regulators change between conditions.
Inferring gene regulatory networks
GRNs can be inferred from gene expression alone, for example with regression models that score how well each TF predicts every gene, which SCENIC then prunes with TF binding motifs Aibar et al., 2017. Multimodal methods such as SCENIC+ additionally require accessible chromatin at a TF’s binding site near the target Bravo González-Blas et al., 2023, see the chromatin accessibility chapter. Alternatively, prior-knowledge networks collect TF-target interactions that were reported in the literature and in databases, such as DoRothEA Garcia-Alonso et al., 2019 and its successor CollecTRI Müller-Dott et al., 2023.
Networks inferred from expression alone recover known interactions barely better than random ones Pratapa et al., 2020, and even multimodal networks change with seeds and method choices and struggle to predict the effects of perturbations Mompel et al., 2024. Unless the question is about regulation that is not yet known, we therefore recommend estimating TF activities from a prior-knowledge network Mompel et al., 2023. A TF’s activity is inferred from the expression of its targets, its footprint, which is more informative than the TF’s own expression, since TFs are often lowly expressed and regulated after transcription.
Environment setup and data
We continue with sample site4-donor8 of the NeurIPS human bone marrow dataset Luecken et al., 2021 and use the cell type annotations curated for the challenge.
import decoupler as dc
import lamindb as ln
import scanpy as sc

sc.set_figure_params(dpi=80, facecolor="white", frameon=False)

ln.connect("theislab/sc-best-practices")
ln.track("s7XDZUXrhnOD")
Output
→ connected lamindb: theislab/sc-best-practices
→ loaded Transform('s7XDZUXrhnOD0000', key='gene_regulatory_networks.ipynb'), started new Run('EA2BfGn30QGBaKwk') at 2026-09-29 13:11:49 UTC
→ notebook imports: decoupler==2.2.0 lamindb-core==2.10.0 scanpy==1.12.4
We keep the gene expression of the sample, normalize it with the shifted logarithm and compute a UMAP for visualization.
adata = ln.Artifact.get(
    key="cellular_structure/openproblems_bmmc_multiome_genes_filtered.h5ad"
).load()
adata = adata[adata.obs["batch"] == "s4d8", adata.var["feature_types"] == "GEX"].copy()
adata.X = adata.layers["counts"].copy()
sc.pp.normalize_total(adata)
sc.pp.log1p(adata)
sc.pp.pca(adata)
sc.pp.neighbors(adata)
sc.tl.umap(adata)
adata
AnnData object with n_obs × n_vars = 9876 × 13431
obs: 'GEX_pct_counts_mt', 'GEX_n_counts', 'GEX_n_genes', 'GEX_size_factors', 'GEX_phase', 'ATAC_nCount_peaks', 'ATAC_atac_fragments', 'ATAC_reads_in_peaks_frac', 'ATAC_blacklist_fraction', 'ATAC_nucleosome_signal', 'cell_type', 'batch', 'ATAC_pseudotime_order', 'GEX_pseudotime_order', 'Samplename', 'Site', 'DonorNumber', 'Modality', 'VendorLot', 'DonorID', 'DonorAge', 'DonorBMI', 'DonorBloodType', 'DonorRace', 'Ethnicity', 'DonorGender', 'QCMeds', 'DonorSmoker'
var: 'feature_types', 'gene_id'
uns: 'ATAC_gene_activity_var_names', 'dataset_id', 'genome', 'organism', 'log1p', 'pca', 'neighbors', 'umap'
obsm: 'ATAC_gene_activity', 'ATAC_lsi_full', 'ATAC_lsi_red', 'ATAC_umap', 'GEX_X_pca', 'GEX_X_umap', 'X_pca', 'X_umap'
varm: 'PCs'
obsp: 'distances', 'connectivities'
layers: 'counts', None (.X)sc.pl.umap(adata, color="cell_type")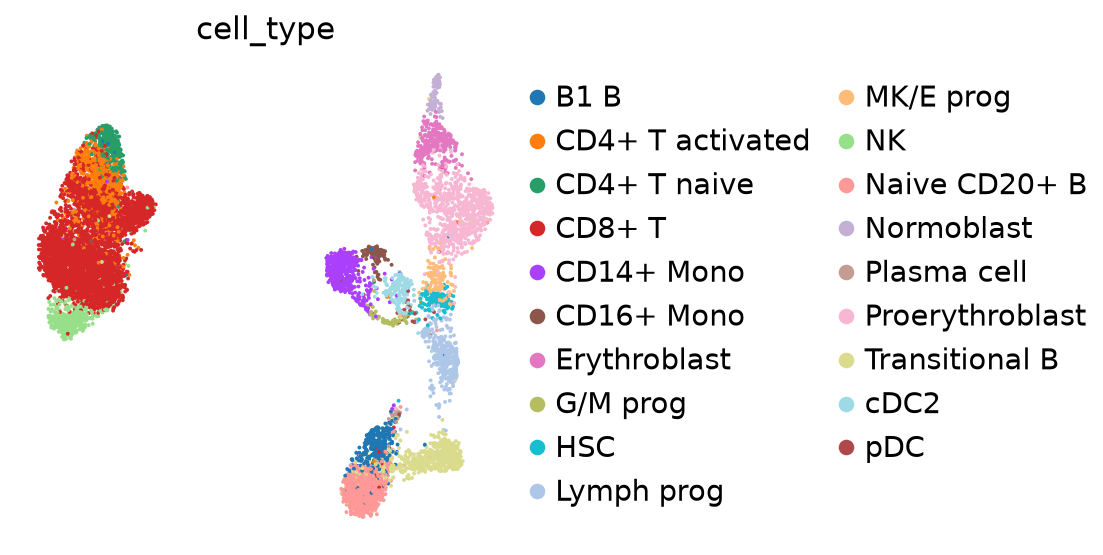
A prior-knowledge network
We use CollecTRI, which gathers signed TF-target interactions for 1,186 TFs from curated databases and text mining Müller-Dott et al., 2023, and which we already loaded in the gene set enrichment chapter.
Each row is an edge from a TF (source) to a target gene (target), with a weight of 1 for activation and -1 for repression.
collectri = ln.Artifact.get(key="conditions/gsea_pathway/collectri.parquet").load()
collectriTranscription factor activities
decoupler Mompel et al., 2022 infers the activity of every TF in every cell with a univariate linear model (ULM) that regresses the cell’s gene expression on the weights of the TF’s regulon. The t-value of the slope is the activity score: it is positive if the targets that the TF activates are expressed higher, and the targets it represses lower, than the other genes in that cell.
dc.mt.ulm(adata, net=collectri)
scores = dc.pp.get_obsm(adata, key="score_ulm")
scores
AnnData object with n_obs × n_vars = 9876 × 593
obs: 'GEX_pct_counts_mt', 'GEX_n_counts', 'GEX_n_genes', 'GEX_size_factors', 'GEX_phase', 'ATAC_nCount_peaks', 'ATAC_atac_fragments', 'ATAC_reads_in_peaks_frac', 'ATAC_blacklist_fraction', 'ATAC_nucleosome_signal', 'cell_type', 'batch', 'ATAC_pseudotime_order', 'GEX_pseudotime_order', 'Samplename', 'Site', 'DonorNumber', 'Modality', 'VendorLot', 'DonorID', 'DonorAge', 'DonorBMI', 'DonorBloodType', 'DonorRace', 'Ethnicity', 'DonorGender', 'QCMeds', 'DonorSmoker'
uns: 'ATAC_gene_activity_var_names', 'dataset_id', 'genome', 'organism', 'log1p', 'pca', 'neighbors', 'umap', 'cell_type_colors'
obsm: 'ATAC_gene_activity', 'ATAC_lsi_full', 'ATAC_lsi_red', 'ATAC_umap', 'GEX_X_pca', 'GEX_X_umap', 'X_pca', 'X_umap', 'score_ulm', 'padj_ulm'
layers: None (.X)TF activities can be visualized like gene expression, here for the B cell regulator PAX5, the erythroid regulator GATA1 and the myeloid regulator SPI1.
sc.pl.umap(scores, color=["PAX5", "GATA1", "SPI1"], cmap="RdBu_r", vcenter=0)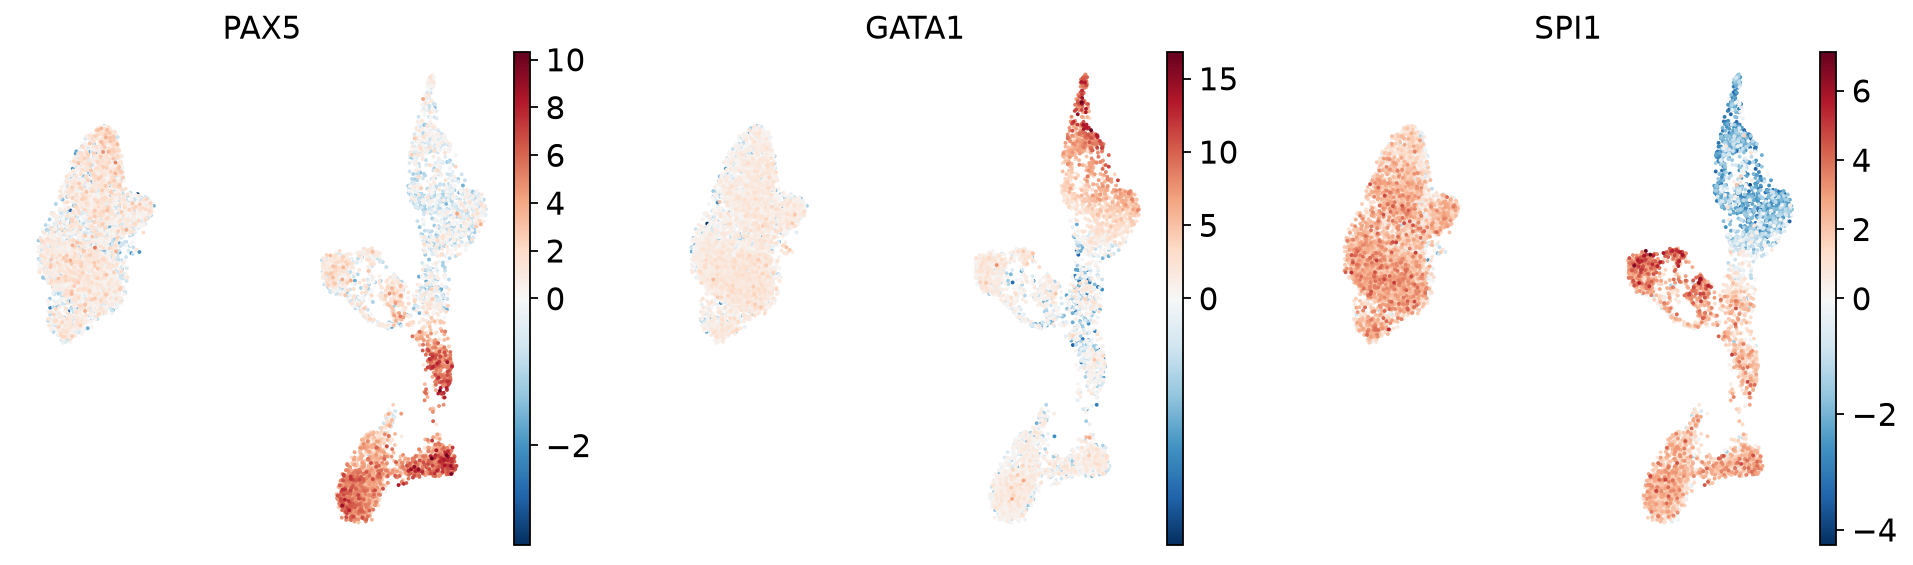
Transcription factors characteristic of cell types
To find the TFs whose activity distinguishes each cell type, we rank the activity scores of every cell type against all other cells.
ranked = dc.tl.rankby_group(scores, groupby="cell_type")
top_tfs = ranked[ranked["stat"] > 0].groupby("group").head(2)
sc.pl.matrixplot(
    scores,
    top_tfs.drop_duplicates("name").groupby("group")["name"].apply(list).to_dict(),
    groupby="cell_type",
    standard_scale="var",
    cmap="RdBu_r",
    colorbar_title="Scaled\nactivity",
)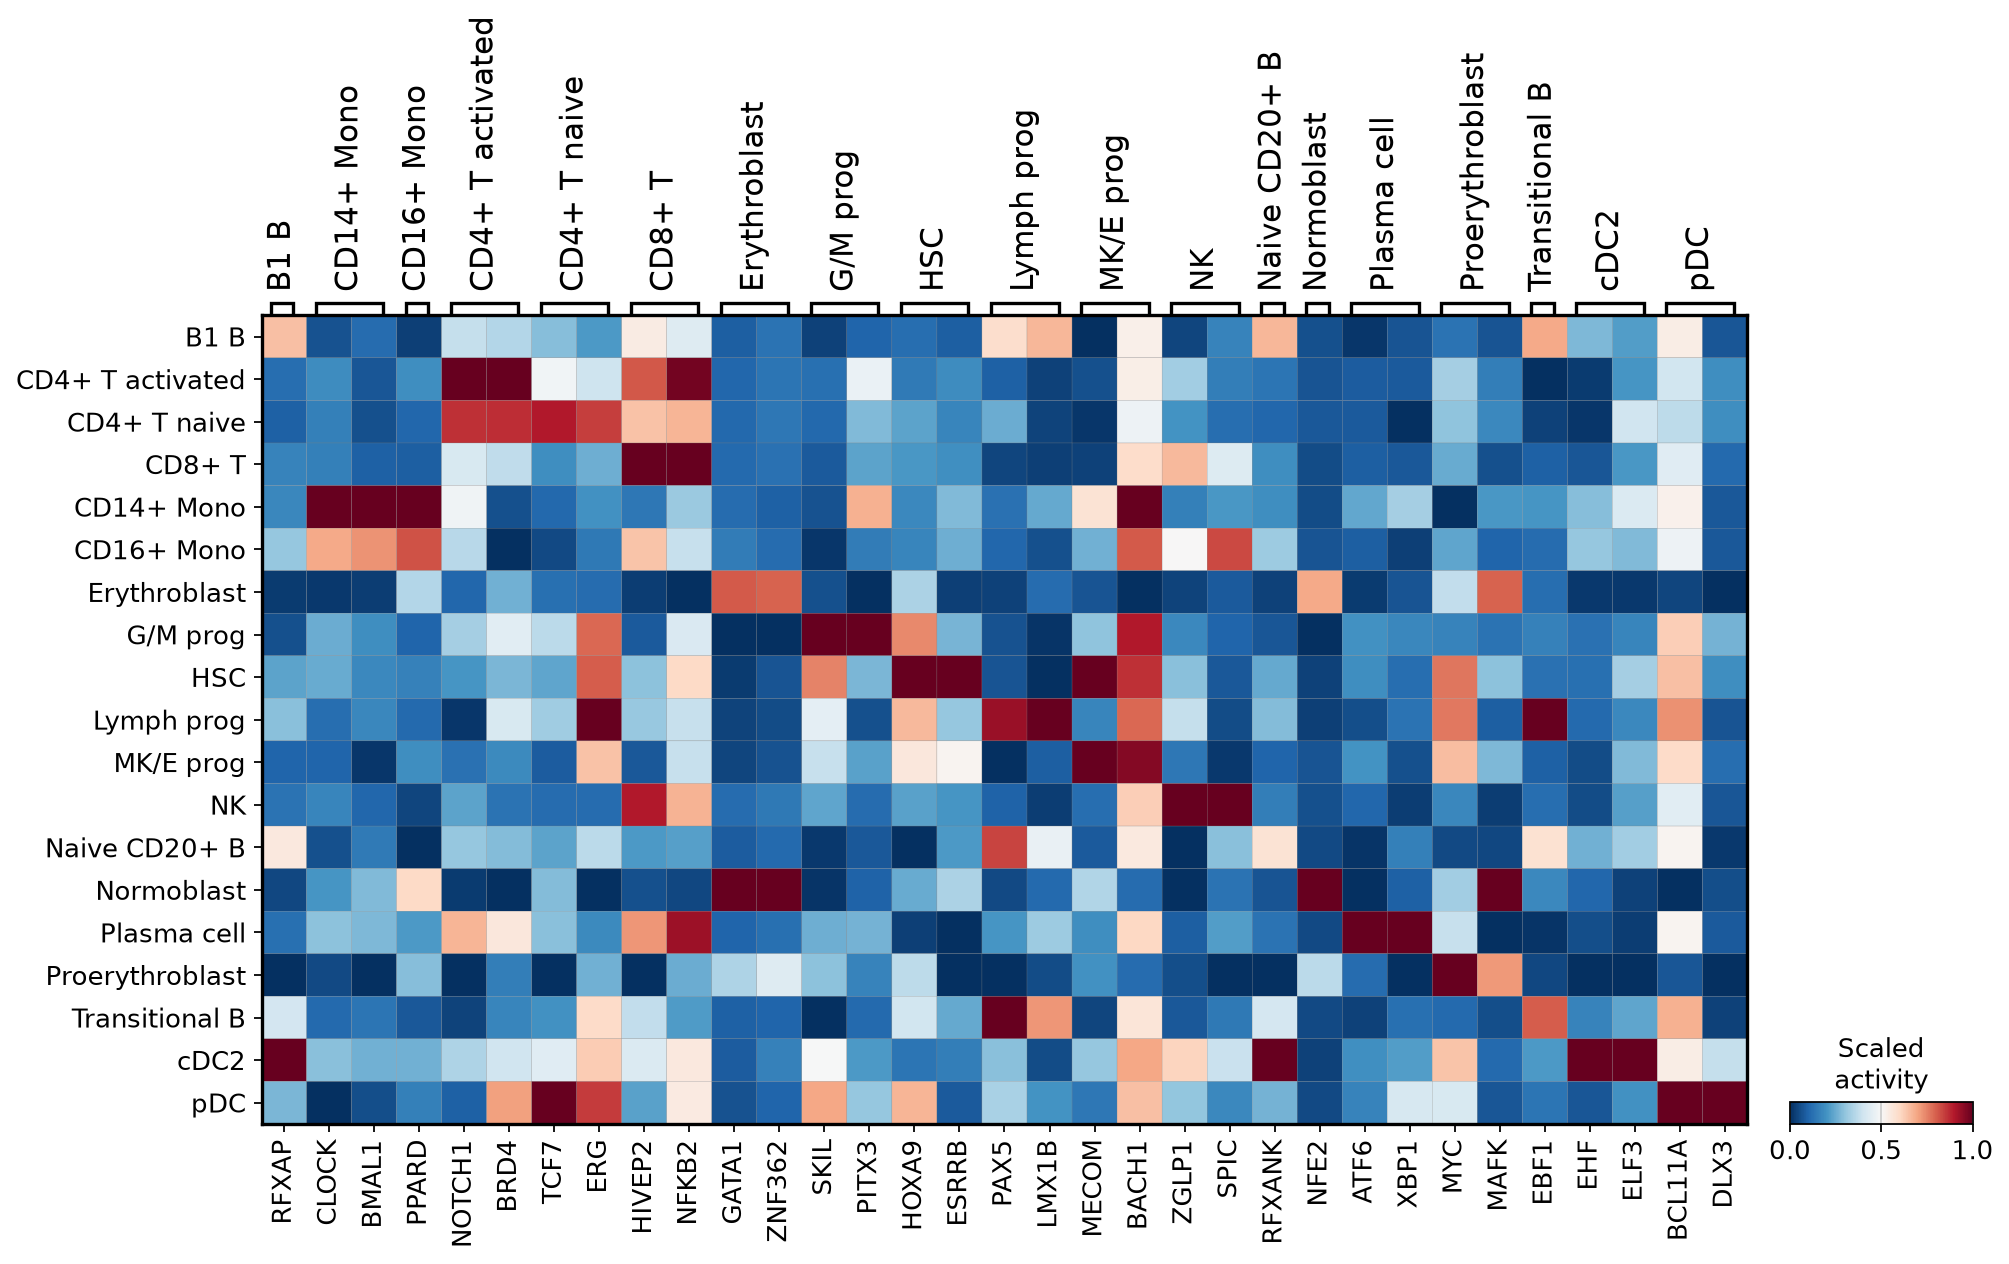
Many of these are well-known regulators, such as PAX5 and EBF1 in B cells and lymphoid progenitors, GATA1 and NFE2 in erythroid cells, HOXA9 and MECOM in HSCs, XBP1 in plasma cells, TCF7 in naive CD4+ T cells and BCL11A in pDCs. Others, such as the circadian regulators CLOCK and BMAL1 in CD14+ monocytes, are less expected and may reflect targets they share with other TFs, so candidate regulators should be checked against known biology before they are interpreted.
Inspecting a regulon
To see which targets drive an activity score, we plot the regulons of PAX5 and EBF1 together with the mean expression of their targets in naive B cells.
naive_b = adata[adata.obs["cell_type"] == "Naive CD20+ B"]
dc.pl.network(
    net=collectri,
    data=naive_b.to_df().mean().to_frame().T,
    score=dc.pp.get_obsm(naive_b, key="score_ulm").to_df().mean().to_frame().T,
    sources=["PAX5", "EBF1"],
    targets=8,
    figsize=(6, 6),
)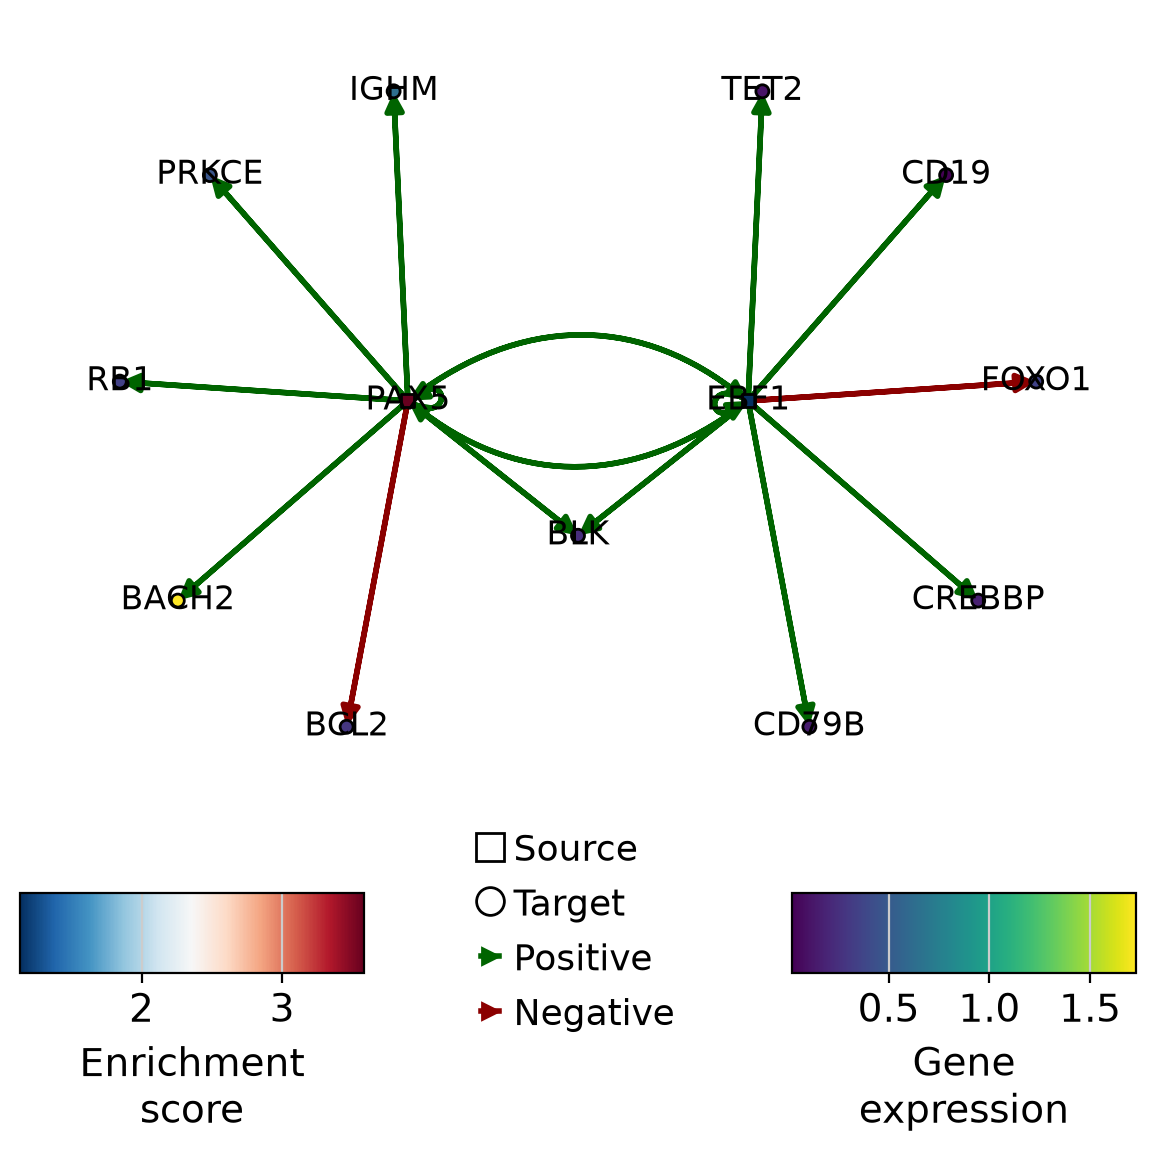
PAX5 and EBF1 activate each other and share targets such as BLK, and EBF1 also activates the B cell receptor components CD19 and CD79B. Several of these targets are detected in only a few cells of this dataset, so no single target decides the activity score, which combines the evidence from the whole regulon.
Quiz
Theory
Transcription factor activity
Contributors
We gratefully acknowledge the contributions of:
Authors
Ignacio Ibarra
Reviewers
Lukas Heumos
Anna Schaar
- Aibar, S., González-Blas, C. B., Moerman, T., Huynh-Thu, V. A., Imrichova, H., Hulselmans, G., Rambow, F., Marine, J.-C., Geurts, P., Aerts, J., van den Oord, J., Atak, Z. K., Wouters, J., & Aerts, S. (2017). SCENIC: single-cell regulatory network inference and clustering. Nat. Methods, 14(11), 1083–1086.
- Bravo González-Blas, C., De Winter, S., Hulselmans, G., Hecker, N., Matetovici, I., Christiaens, V., Poovathingal, S., Wouters, J., Aibar, S., & Aerts, S. (2023). SCENIC+: single-cell multiomic inference of enhancers and gene regulatory networks. Nature Methods, 20(9), 1355–1367. 10.1038/s41592-023-01938-4
- Garcia-Alonso, L., Holland, C. H., Ibrahim, M. M., Turei, D., & Saez-Rodriguez, J. (2019). Benchmark and integration of resources for the estimation of human transcription factor activities. Genome Res., 29(8), 1363–1375.
- Müller-Dott, S., Tsirvouli, E., Vazquez, M., Ramirez Flores, R. O., Badia-i Mompel, P., Fallegger, R., Türei, D., Lægreid, A., & Saez-Rodriguez, J. (2023). Expanding the coverage of regulons from high-confidence prior knowledge for accurate estimation of transcription factor activities. Nucleic Acids Research, 51(20), 10934–10949. 10.1093/nar/gkad841
- Pratapa, A., Jalihal, A. P., Law, J. N., Bharadwaj, A., & Murali, T. M. (2020). Benchmarking algorithms for gene regulatory network inference from single-cell transcriptomic data. Nat. Methods, 17(2), 147–154.
- Badia-i Mompel, P., Casals-Franch, R., Wessels, L., Müller-Dott, S., Trimbour, R., Yang, Y., Ramirez Flores, R. O., & Saez-Rodriguez, J. (2024). Comparison and evaluation of methods to infer gene regulatory networks from multimodal single-cell data. bioRxiv. 10.1101/2024.12.20.629764
- Badia-i Mompel, P., Wessels, L., Müller-Dott, S., Trimbour, R., Ramirez Flores, R. O., Argelaguet, R., & Saez-Rodriguez, J. (2023). Gene regulatory network inference in the era of single-cell multi-omics. Nature Reviews Genetics, 24(11), 739–754. 10.1038/s41576-023-00618-5
- Luecken, M. D., Burkhardt, D. B., Cannoodt, R., Lance, C., Agrawal, A., Aliee, H., Chen, A. T., Deconinck, L., Detweiler, A. M., Granados, A. A., Huynh, S., Isacco, L., Kim, Y. J., Klein, D., KUMAR, B. D., Kuppasani, S., Lickert, H., McGeever, A., Mekonen, H., … Bloom, J. M. (2021). A sandbox for prediction and integration of DNA, RNA, and proteins in single cells. Thirty-Fifth Conference on Neural Information Processing Systems Datasets and Benchmarks Track (Round 2). https://openreview.net/forum?id=gN35BGa1Rt
- Badia-i Mompel, P., Vélez Santiago, J., Braunger, J., Geiss, C., Dimitrov, D., Müller-Dott, S., Taus, P., Dugourd, A., Holland, C. H., Ramirez Flores, R. O., & Saez-Rodriguez, J. (2022). decoupleR: ensemble of computational methods to infer biological activities from omics data. Bioinformatics Advances, 2(1), vbac016. 10.1093/bioadv/vbac016