🧠 Key takeaways
Paired integration combines modalities measured in the same cells into one representation, and no method is best for every dataset.
Integrated embeddings should be scored against the unimodal embeddings with metrics for cell type conservation and batch mixing.
WNN is a strong baseline for CITE-seq and Multiome data, and totalVI and MultiVI additionally model raw counts and batch effects.
⚙️ Environment setup
Install conda:
Before creating the environment, ensure that conda is installed on your system.
Save the yml content:
Copy the content from the yml tab into a file named
environment.yml.
Create the environment:
Open a terminal or command prompt.
Run the following command:
conda env create -f environment.yml
Activate the environment:
After the environment is created, activate it using:
conda activate <environment_name>Replace
<environment_name>with the name specified in theenvironment.ymlfile. In the yml file it will look like this:name: <environment_name>
Verify the installation:
Check that the environment was created successfully by running:
conda env list
name: multimodal-integration
channels:
  - conda-forge
  - bioconda
dependencies:
  - bioconda::bedtools=2.31.1
  - conda-forge::ipykernel=7.3.0
  - conda-forge::ipywidgets=8.1.9
  - conda-forge::python=3.13.15
  - conda-forge::scanpy=1.12.4
  - pip
  - pip:
      - lamindb==2.10.0
      - mofapy2==0.7.5
      - muon==0.1.9
      - scglue==0.4.1
      - scib-metrics==0.6.1
      - scvi-tools==1.5.1
🗄️ Get data and notebooks
This book uses lamindb to store, share, and load datasets and notebooks using the theislab/sc-best-practices instance. We acknowledge free hosting from Lamin Labs.
Install lamindb
Install the lamindb Python package:
pip install lamindbOptionally create a lamin account
Sign up and log in following the instructions
Verify your setup
Run the
lamin connectcommand:
import lamindb as ln

ln.Artifact.connect("theislab/sc-best-practices").df()
You should now see up to 100 of the stored datasets.
Accessing datasets (Artifacts)
Search for the datasets on the Artifacts page
Load an Artifact and the corresponding object:
import lamindb as ln

af = ln.Artifact.connect("theislab/sc-best-practices").get(
    key="key_of_dataset", is_latest=True
)
obj = af.load()
The object is now accessible in memory and is ready for analysis. Adapt the
lamindb.Artifact.connect("theislab/sc-best-practices").get("SOMEIDXXXX")suffix to get respective versions.Accessing notebooks (Transforms)
Search for the notebook on the Transforms page
Load the notebook:
lamin load <notebook url>which will download the notebook to the current working directory. Analogously to
Artifacts, you can adapt the suffix ID to get older versions.
Motivation
Assays such as CITE-seq and 10x Multiome measure two modalities in the same cells: gene expression together with surface proteins or with chromatin accessibility. Integrating them yields one representation per cell that combines the information of both modalities, which is called paired or vertical integration. The modalities differ in their number of features, from about a hundred proteins to more than 100,000 peaks, and in their noise and count distributions, so each needs its own preprocessing or likelihood.
Three recent benchmarks agree that no method is best for every dataset Hu et al., 2024Fu et al., 2025Liu et al., 2025. Weighted nearest neighbors (WNN) ranked at or near the top for both CITE-seq and Multiome data, and totalVI ranked among the best methods for CITE-seq, especially across batches. We integrate a CITE-seq and a Multiome dataset with these methods, compare them with MOFA+ and MultiVI, and score all embeddings against the unimodal ones.
Dataset
We use bone marrow mononuclear cells of the NeurIPS 2021 multimodal integration challenge, which were measured with CITE-seq and with 10x Multiome at four sites Luecken et al., 2021. To keep run times short, we use the three donors of the first site, whose samples still form three batches.
import logging
import warnings

warnings.filterwarnings("ignore")
logging.getLogger("jax").setLevel(logging.ERROR)

import anndata as ad
import lamindb as ln
import muon as mu
import scanpy as sc
import scvi
from scib_metrics.benchmark import Benchmarker

scvi.settings.seed = 0

ln.connect("theislab/sc-best-practices")

ln.track("m4RWUGhX2RO8")
Output
→ connected lamindb: theislab/sc-best-practices
Seed set to 0
! It looks like you are running jupyter lab but don't have jupyter-server module installed. Please install it via pip install jupyter-server
→ loaded Transform('m4RWUGhX2RO80000', key='paired_integration.ipynb'), started new Run('4RAPew33xe4LCOAE') at 2026-09-30 12:52:59 UTC
→ notebook imports: anndata==0.13.2 lamindb-core==2.10.0 muon==0.1.9 scanpy==1.12.4 scib-metrics==0.6.1 scvi-tools==1.5.1
CITE-seq
The CITE-seq data contain the raw counts of 13,953 genes and 134 surface proteins.
mdata = ln.Artifact.get(key="multimodal_integration/neurips2021_cite.h5mu").load()
mdata = mdata[mdata["rna"].obs["site"] == "site1"].copy()
mdata.pull_obs()
rna, adt = mdata["rna"], mdata["adt"]
mdata
MuData object with n_obs × n_vars = 16311 × 14087
2 modalities
rna: 16311 × 13953
obs: 'cell_type', 'batch', 'site', 'donor', 'cell_type_l1'
var: 'gene_id'
layers: None
adt: 16311 × 134
obs: 'cell_type', 'batch', 'site', 'donor', 'cell_type_l1'
layers: NoneWe normalize the gene expression with the shifted logarithm and select highly variable genes as described in the preprocessing chapters. Protein counts are normalized with the centered log ratio (CLR) transformation as described in the surface protein chapter. Both modalities keep their raw counts in a layer for the count-based models.
for data in (rna, adt):
    data.layers["counts"] = data.X.copy()
sc.pp.normalize_total(rna)
sc.pp.log1p(rna)
sc.pp.highly_variable_genes(rna, n_top_genes=4000, batch_key="batch")
sc.pp.pca(rna, mask_var="highly_variable")
adt.X = adt.X.tocsc()
mu.prot.pp.clr(adt)
sc.pp.pca(adt, n_comps=30)
embeddings = ad.AnnData(obs=rna.obs[["cell_type", "cell_type_l1", "batch"]])
embeddings.obsm["RNA"] = rna.obsm["X_pca"]
embeddings.obsm["Protein"] = adt.obsm["X_pca"]
Output
Weighted nearest neighbors
WNN learns for every cell how informative each modality is, based on how well the neighbors in one modality predict its profile in the other, and combines the neighbor graphs of both modalities with these weights Hao et al., 2021. muon implements WNN on top of the neighbor graphs of the individual modalities Bredikhin et al., 2022.
sc.pp.neighbors(rna)
sc.pp.neighbors(adt)
mu.pp.neighbors(mdata, key_added="wnn")
mu.tl.umap(mdata, neighbors_key="wnn")
mu.pl.umap(mdata, color=["rna:cell_type_l1", "rna:batch"], wspace=0.4)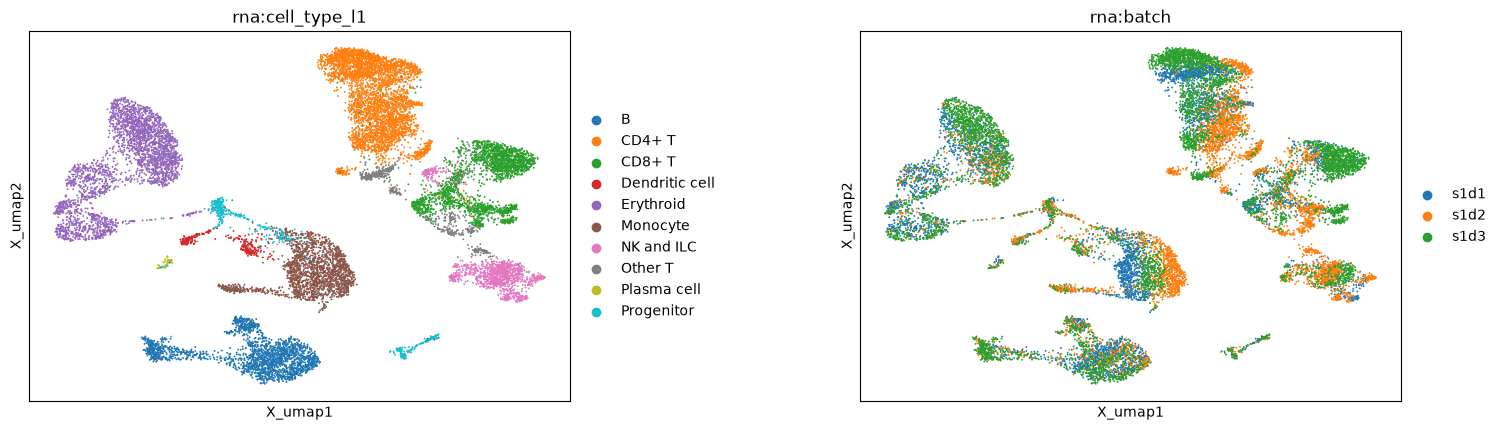
WNN separates the lineages clearly, but cells of the same type still split by donor, since WNN combines the neighbor graphs of the uncorrected modalities. With several batches, WNN therefore needs batch-corrected inputs for each modality.
MOFA+
MOFA+ is a linear factor model that decomposes all modalities into a small number of factors, whose feature weights make them interpretable Argelaguet et al., 2020. We fit 20 factors on the highly variable genes and all proteins, and let MOFA+ model the three batches as groups.
adt.var["highly_variable"] = True
mdata.pull_var("highly_variable")
mu.tl.mofa(
    mdata, groups_label="rna:batch", use_var="highly_variable", n_factors=20, quiet=True
)
Output
        #########################################################
        ###           __  __  ____  ______                    ###
        ###          |  \/  |/ __ \|  ____/\    _             ###
        ###          | \  / | |  | | |__ /  \ _| |_           ###
        ###          | |\/| | |  | |  __/ /\ \_   _|          ###
        ###          | |  | | |__| | | / ____ \|_|            ###
        ###          |_|  |_|\____/|_|/_/    \_\              ###
        ###                                                   ###
        #########################################################
Loaded view='rna' group='s1d1' with N=5227 samples and D=4000 features...
Loaded view='rna' group='s1d2' with N=4978 samples and D=4000 features...
Loaded view='rna' group='s1d3' with N=6106 samples and D=4000 features...
Loaded view='adt' group='s1d1' with N=5227 samples and D=134 features...
Loaded view='adt' group='s1d2' with N=4978 samples and D=134 features...
Loaded view='adt' group='s1d3' with N=6106 samples and D=134 features...
Model options:
- Automatic Relevance Determination prior on the factors: True
- Automatic Relevance Determination prior on the weights: True
- Spike-and-slab prior on the factors: False
- Spike-and-slab prior on the weights: True
Likelihoods:
- View 0 (rna): gaussian
- View 1 (adt): gaussian
######################################
## Training the model with seed 1 ##
######################################
Converged!


#######################
## Training finished ##
#######################


Saving model in /tmp/mofa_20260930-145339.hdf5...
Saved MOFA embeddings in .obsm['X_mofa'] slot and their loadings in .varm['LFs'].
totalVI
totalVI is a variational autoencoder that models the RNA counts with a negative binomial distribution and the protein counts as a mixture of foreground and background, which accounts for the unspecific binding of antibodies Gayoso et al., 2021. It corrects batch effects in the same model and takes the raw counts of both modalities as input.
rna_hvg = rna[:, rna.var["highly_variable"]].copy()
rna_hvg.obsm["protein_counts"] = adt.layers["counts"].toarray()
scvi.model.TOTALVI.setup_anndata(
    rna_hvg,
    layer="counts",
    batch_key="batch",
    protein_expression_obsm_key="protein_counts",
)
totalvi = scvi.model.TOTALVI(rna_hvg)
totalvi.train()
embeddings.obsm["totalVI"] = totalvi.get_latent_representation()
Output
INFO Generating sequential column names
INFO Computing empirical prior initialization for protein background.
Trainer will use only 1 of 2 GPUs because it is running inside an interactive / notebook environment. You may try to set `Trainer(devices=2)` but please note that multi-GPU inside interactive / notebook environments is considered experimental and unstable. Your mileage may vary.
GPU available: True (cuda), used: True
TPU available: False, using: 0 TPU cores
💡 Tip: For seamless cloud logging and experiment tracking, try installing [litlogger](https://pypi.org/project/litlogger/) to enable LitLogger, which logs metrics and artifacts automatically to the Lightning Experiments platform.
You are using a CUDA device ('NVIDIA RTX PRO 6000 Blackwell Workstation Edition') that has Tensor Cores. To properly utilize them, you should set `torch.set_float32_matmul_precision('medium' | 'high')` which will trade-off precision for performance. For more details, read https://pytorch.org/docs/stable/generated/torch.set_float32_matmul_precision.html#torch.set_float32_matmul_precision
LOCAL_RANK: 0 - CUDA_VISIBLE_DEVICES: [0,1]
`Trainer.fit` stopped: `max_epochs=400` reached.
sc.pp.neighbors(embeddings, use_rep="totalVI")
sc.tl.umap(embeddings)
sc.pl.umap(embeddings, color=["cell_type_l1", "batch"], wspace=0.4)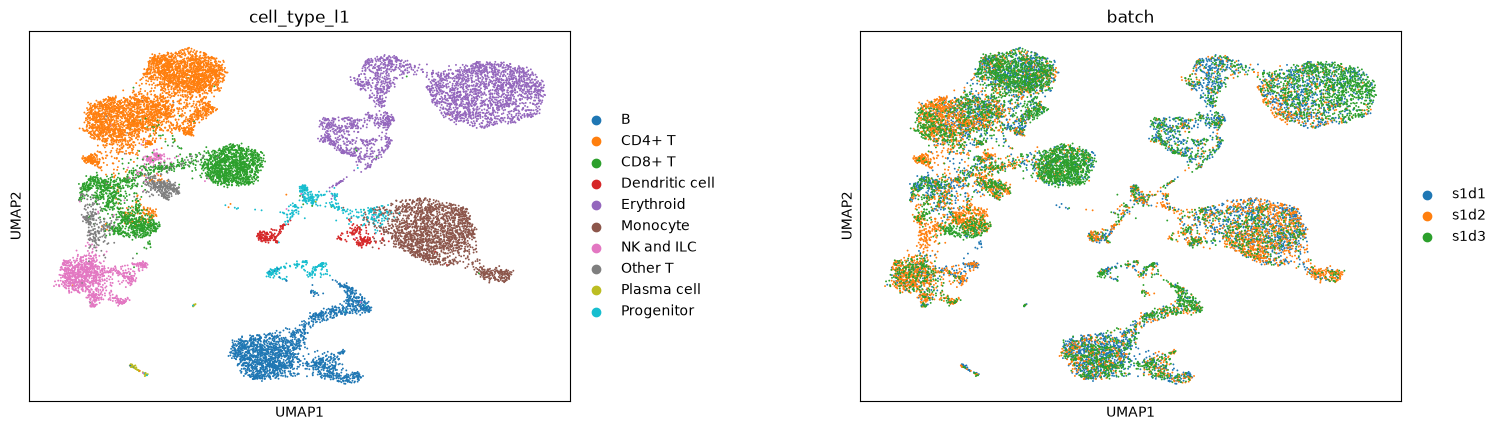
totalVI mixes the three donors within each cell type, since it models the batches together with both modalities.
Evaluation
We score the embeddings with the scIB metrics, which measure how well cell types are conserved and batches are mixed Luecken et al., 2022. scib-metrics replaces the silhouette-based batch metric by BRAS, since silhouette scores can reward embeddings that do not remove batch effects Rautenstrauch & Ohler, 2026. The PCA embeddings of the individual modalities serve as baselines, and the WNN graph cannot be scored with these embedding-based metrics.
embeddings.obsm["MOFA+"] = mdata.obsm["X_mofa"]
benchmark = Benchmarker(
    embeddings,
    batch_key="batch",
    label_key="cell_type",
    embedding_obsm_keys=["RNA", "Protein", "MOFA+", "totalVI"],
    pre_integrated_embedding_obsm_key="RNA",
)
benchmark.benchmark()
Output
Computing neighbors: 0%| | 0/4 [00:00<?, ?it/s]Computing neighbors: 25%|██▌ | 1/4 [00:05<00:15, 5.28s/it]Computing neighbors: 50%|█████ | 2/4 [00:10<00:10, 5.10s/it]Computing neighbors: 75%|███████▌ | 3/4 [00:15<00:05, 5.04s/it]Computing neighbors: 100%|██████████| 4/4 [00:20<00:00, 5.04s/it]Computing neighbors: 100%|██████████| 4/4 [00:20<00:00, 5.06s/it]
Embeddings: 0%| | 0/4 [00:00<?, ?it/s]
Metrics: 0%| | 0/11 [00:00<?, ?it/s]
Metrics: 0%| | 0/11 [00:00<?, ?it/s, Bio conservation: isolated_labels]
Metrics: 9%|▉ | 1/11 [00:01<00:11, 1.14s/it, Bio conservation: isolated_labels]
Metrics: 9%|▉ | 1/11 [00:01<00:11, 1.14s/it, Bio conservation: nmi_ari_cluster_labels_kmeans]
Metrics: 18%|█▊ | 2/11 [00:07<00:37, 4.18s/it, Bio conservation: nmi_ari_cluster_labels_kmeans]
Metrics: 18%|█▊ | 2/11 [00:07<00:37, 4.18s/it, Bio conservation: silhouette_label]
Metrics: 27%|██▋ | 3/11 [00:08<00:21, 2.63s/it, Bio conservation: silhouette_label]
Metrics: 27%|██▋ | 3/11 [00:08<00:21, 2.63s/it, Bio conservation: clisi_knn]
Metrics: 36%|███▋ | 4/11 [00:09<00:13, 1.97s/it, Bio conservation: clisi_knn]
Metrics: 36%|███▋ | 4/11 [00:09<00:13, 1.97s/it, Batch correction: bras]
Metrics: 45%|████▌ | 5/11 [00:22<00:37, 6.18s/it, Batch correction: bras]
Metrics: 45%|████▌ | 5/11 [00:23<00:37, 6.18s/it, Batch correction: ilisi_knn]
Metrics: 55%|█████▍ | 6/11 [00:23<00:21, 4.28s/it, Batch correction: ilisi_knn]
Metrics: 55%|█████▍ | 6/11 [00:23<00:21, 4.28s/it, Batch correction: kbet_per_label]INFO Diffusion distance failed. Skip.
INFO CD8+ T CD57+ CD45RO+ consists of a single batch or is too small. Skip.
INFO CD8+ T naive CD127+ CD26- CD101- consists of a single batch or is too small. Skip.
INFO ILC consists of a single batch or is too small. Skip.
INFO Plasma cell IGKC- consists of a single batch or is too small. Skip.
INFO dnT consists of a single batch or is too small. Skip.
Metrics: 64%|██████▎ | 7/11 [00:34<00:26, 6.64s/it, Batch correction: kbet_per_label]
Metrics: 64%|██████▎ | 7/11 [00:35<00:26, 6.64s/it, Batch correction: graph_connectivity]
Metrics: 73%|███████▎ | 8/11 [00:35<00:14, 4.71s/it, Batch correction: graph_connectivity]
Metrics: 73%|███████▎ | 8/11 [00:36<00:14, 4.71s/it, Batch correction: pcr_comparison]
Metrics: 82%|████████▏ | 9/11 [00:36<00:06, 3.49s/it, Batch correction: pcr_comparison]Embeddings: 25%|██▌ | 1/4 [00:36<01:50, 36.88s/it]
Metrics: 0%| | 0/11 [00:00<?, ?it/s]
Metrics: 0%| | 0/11 [00:00<?, ?it/s, Bio conservation: isolated_labels]
Metrics: 9%|▉ | 1/11 [00:00<00:08, 1.13it/s, Bio conservation: isolated_labels]
Metrics: 9%|▉ | 1/11 [00:01<00:08, 1.13it/s, Bio conservation: nmi_ari_cluster_labels_kmeans]
Metrics: 18%|█▊ | 2/11 [00:05<00:29, 3.32s/it, Bio conservation: nmi_ari_cluster_labels_kmeans]
Metrics: 18%|█▊ | 2/11 [00:06<00:29, 3.32s/it, Bio conservation: silhouette_label]
Metrics: 27%|██▋ | 3/11 [00:06<00:17, 2.20s/it, Bio conservation: silhouette_label]
Metrics: 27%|██▋ | 3/11 [00:07<00:17, 2.20s/it, Bio conservation: clisi_knn]
Metrics: 36%|███▋ | 4/11 [00:07<00:11, 1.57s/it, Bio conservation: clisi_knn]
Metrics: 36%|███▋ | 4/11 [00:07<00:11, 1.57s/it, Batch correction: bras]
Metrics: 45%|████▌ | 5/11 [00:09<00:10, 1.71s/it, Batch correction: bras]
Metrics: 45%|████▌ | 5/11 [00:09<00:10, 1.71s/it, Batch correction: ilisi_knn]
Metrics: 55%|█████▍ | 6/11 [00:09<00:06, 1.33s/it, Batch correction: ilisi_knn]
Metrics: 55%|█████▍ | 6/11 [00:10<00:06, 1.33s/it, Batch correction: kbet_per_label]INFO Diffusion distance failed. Skip.
INFO CD8+ T CD57+ CD45RO+ consists of a single batch or is too small. Skip.
INFO CD8+ T naive CD127+ CD26- CD101- consists of a single batch or is too small. Skip.
INFO ILC consists of a single batch or is too small. Skip.
INFO Plasma cell IGKC- consists of a single batch or is too small. Skip.
INFO dnT consists of a single batch or is too small. Skip.
Metrics: 64%|██████▎ | 7/11 [00:18<00:15, 3.82s/it, Batch correction: kbet_per_label]
Metrics: 64%|██████▎ | 7/11 [00:19<00:15, 3.82s/it, Batch correction: graph_connectivity]
Metrics: 73%|███████▎ | 8/11 [00:19<00:08, 2.79s/it, Batch correction: graph_connectivity]
Metrics: 73%|███████▎ | 8/11 [00:20<00:08, 2.79s/it, Batch correction: pcr_comparison]
Metrics: 82%|████████▏ | 9/11 [00:20<00:04, 2.17s/it, Batch correction: pcr_comparison]Embeddings: 50%|█████ | 2/4 [00:57<00:54, 27.46s/it]
Metrics: 0%| | 0/11 [00:00<?, ?it/s]
Metrics: 0%| | 0/11 [00:00<?, ?it/s, Bio conservation: isolated_labels]
Metrics: 9%|▉ | 1/11 [00:00<00:09, 1.09it/s, Bio conservation: isolated_labels]
Metrics: 9%|▉ | 1/11 [00:02<00:09, 1.09it/s, Bio conservation: nmi_ari_cluster_labels_kmeans]
Metrics: 18%|█▊ | 2/11 [00:05<00:27, 3.05s/it, Bio conservation: nmi_ari_cluster_labels_kmeans]
Metrics: 18%|█▊ | 2/11 [00:06<00:27, 3.05s/it, Bio conservation: silhouette_label]
Metrics: 27%|██▋ | 3/11 [00:06<00:16, 2.07s/it, Bio conservation: silhouette_label]
Metrics: 27%|██▋ | 3/11 [00:06<00:16, 2.07s/it, Bio conservation: clisi_knn]
Metrics: 36%|███▋ | 4/11 [00:07<00:10, 1.51s/it, Bio conservation: clisi_knn]
Metrics: 36%|███▋ | 4/11 [00:07<00:10, 1.51s/it, Batch correction: bras]
Metrics: 45%|████▌ | 5/11 [00:09<00:10, 1.71s/it, Batch correction: bras]
Metrics: 45%|████▌ | 5/11 [00:09<00:10, 1.71s/it, Batch correction: ilisi_knn]
Metrics: 55%|█████▍ | 6/11 [00:09<00:06, 1.34s/it, Batch correction: ilisi_knn]
Metrics: 55%|█████▍ | 6/11 [00:10<00:06, 1.34s/it, Batch correction: kbet_per_label]INFO Diffusion distance failed. Skip.
INFO CD8+ T CD57+ CD45RO+ consists of a single batch or is too small. Skip.
INFO CD8+ T naive CD127+ CD26- CD101- consists of a single batch or is too small. Skip.
INFO ILC consists of a single batch or is too small. Skip.
INFO Plasma cell IGKC- consists of a single batch or is too small. Skip.
INFO dnT consists of a single batch or is too small. Skip.
Metrics: 64%|██████▎ | 7/11 [00:17<00:13, 3.30s/it, Batch correction: kbet_per_label]
Metrics: 64%|██████▎ | 7/11 [00:17<00:13, 3.30s/it, Batch correction: graph_connectivity]
Metrics: 73%|███████▎ | 8/11 [00:17<00:07, 2.46s/it, Batch correction: graph_connectivity]
Metrics: 73%|███████▎ | 8/11 [00:18<00:07, 2.46s/it, Batch correction: pcr_comparison]
Metrics: 82%|████████▏ | 9/11 [00:18<00:03, 1.94s/it, Batch correction: pcr_comparison]Embeddings: 75%|███████▌ | 3/4 [01:16<00:23, 23.65s/it]
Metrics: 0%| | 0/11 [00:00<?, ?it/s]
Metrics: 0%| | 0/11 [00:00<?, ?it/s, Bio conservation: isolated_labels]
Metrics: 9%|▉ | 1/11 [00:00<00:09, 1.10it/s, Bio conservation: isolated_labels]
Metrics: 9%|▉ | 1/11 [00:02<00:09, 1.10it/s, Bio conservation: nmi_ari_cluster_labels_kmeans]
Metrics: 18%|█▊ | 2/11 [00:05<00:28, 3.12s/it, Bio conservation: nmi_ari_cluster_labels_kmeans]
Metrics: 18%|█▊ | 2/11 [00:06<00:28, 3.12s/it, Bio conservation: silhouette_label]
Metrics: 27%|██▋ | 3/11 [00:06<00:16, 2.12s/it, Bio conservation: silhouette_label]
Metrics: 27%|██▋ | 3/11 [00:07<00:16, 2.12s/it, Bio conservation: clisi_knn]
Metrics: 36%|███▋ | 4/11 [00:07<00:10, 1.54s/it, Bio conservation: clisi_knn]
Metrics: 36%|███▋ | 4/11 [00:07<00:10, 1.54s/it, Batch correction: bras]
Metrics: 45%|████▌ | 5/11 [00:07<00:07, 1.24s/it, Batch correction: bras]
Metrics: 45%|████▌ | 5/11 [00:08<00:07, 1.24s/it, Batch correction: ilisi_knn]
Metrics: 55%|█████▍ | 6/11 [00:08<00:05, 1.04s/it, Batch correction: ilisi_knn]
Metrics: 55%|█████▍ | 6/11 [00:09<00:05, 1.04s/it, Batch correction: kbet_per_label]INFO Diffusion distance failed. Skip.
INFO CD8+ T CD57+ CD45RO+ consists of a single batch or is too small. Skip.
INFO CD8+ T naive CD127+ CD26- CD101- consists of a single batch or is too small. Skip.
INFO ILC consists of a single batch or is too small. Skip.
INFO Plasma cell IGKC- consists of a single batch or is too small. Skip.
INFO dnT consists of a single batch or is too small. Skip.
Metrics: 64%|██████▎ | 7/11 [00:15<00:12, 3.05s/it, Batch correction: kbet_per_label]
Metrics: 64%|██████▎ | 7/11 [00:16<00:12, 3.05s/it, Batch correction: graph_connectivity]
Metrics: 73%|███████▎ | 8/11 [00:16<00:06, 2.28s/it, Batch correction: graph_connectivity]
Metrics: 73%|███████▎ | 8/11 [00:16<00:06, 2.28s/it, Batch correction: pcr_comparison]
Metrics: 82%|████████▏ | 9/11 [00:16<00:03, 1.77s/it, Batch correction: pcr_comparison]Embeddings: 100%|██████████| 4/4 [01:34<00:00, 21.27s/it]Embeddings: 100%|██████████| 4/4 [01:34<00:00, 23.62s/it]
_ = benchmark.plot_results_table(min_max_scale=False)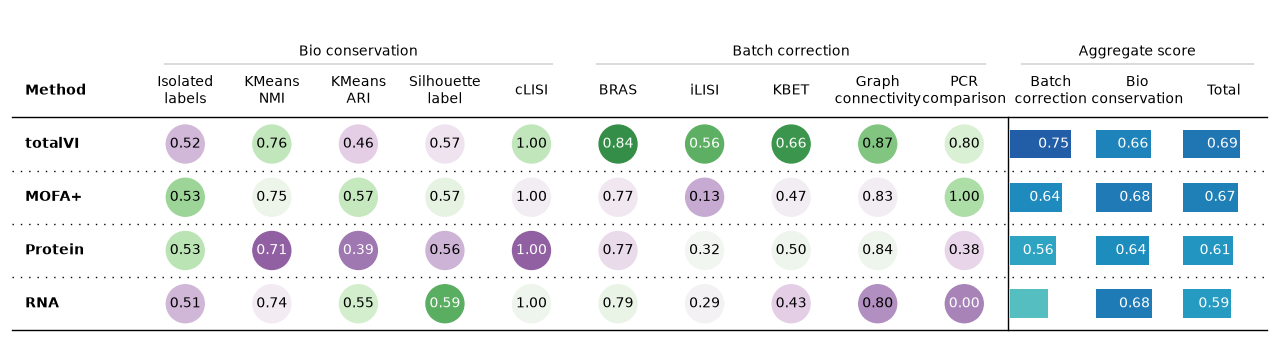
totalVI achieves the best overall score, mainly because it removes the batch effects, whereas all embeddings conserve the cell types similarly well. MOFA+ conserves cell types as well as the RNA alone, and its factors can additionally be interpreted through their gene and protein weights.
Multiome
Chromatin accessibility is measured in more than 100,000 peaks and is very sparse. We reduce it with latent semantic indexing (LSI), which applies a singular value decomposition to the TF-IDF normalized counts, and drop the first component, which mostly captures sequencing depth, as described in the chromatin accessibility chapters.
mdata = ln.Artifact.get(key="multimodal_integration/neurips2021_multiome.h5mu").load()
mdata = mdata[mdata["rna"].obs["site"] == "site1"].copy()
mdata.pull_obs()
rna, atac = mdata["rna"], mdata["atac"]
for data in (rna, atac):
    data.layers["counts"] = data.X.copy()
sc.pp.normalize_total(rna)
sc.pp.log1p(rna)
sc.pp.highly_variable_genes(rna, n_top_genes=4000, batch_key="batch")
sc.pp.pca(rna, mask_var="highly_variable")
mu.atac.pp.tfidf(atac, scale_factor=1e4)
mu.atac.tl.lsi(atac)
atac.obsm["X_lsi"] = atac.obsm["X_lsi"][:, 1:]
embeddings = ad.AnnData(obs=rna.obs[["cell_type", "cell_type_l1", "batch"]])
embeddings.obsm["RNA"] = rna.obsm["X_pca"]
embeddings.obsm["ATAC"] = atac.obsm["X_lsi"]
Weighted nearest neighbors
sc.pp.neighbors(rna)
sc.pp.neighbors(atac, use_rep="X_lsi")
mu.pp.neighbors(mdata, key_added="wnn")
mu.tl.umap(mdata, neighbors_key="wnn")
mu.pl.umap(mdata, color=["rna:cell_type_l1", "rna:batch"], wspace=0.4)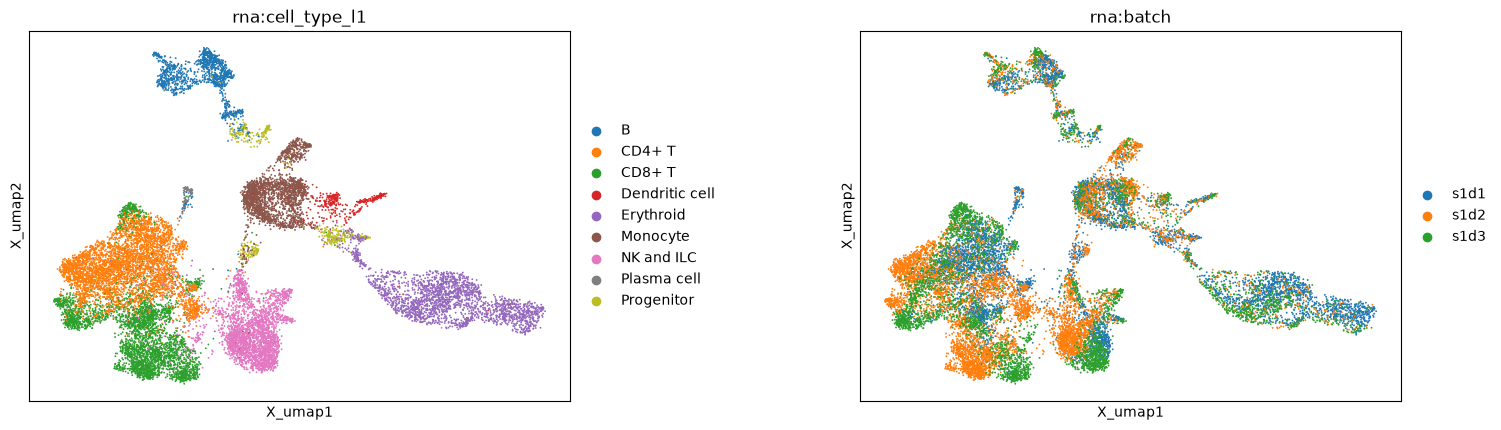
MultiVI
MultiVI extends the variational autoencoder of scVI to chromatin accessibility and learns a joint embedding from the raw counts of both modalities Ashuach et al., 2023. It models whether a region is accessible rather than how many fragments it contains, although fragment counts carry additional information Martens et al., 2024.
mdata_hvg = mdata[
    :, mdata["rna"].var_names[rna.var["highly_variable"]].append(atac.var_names)
].copy()
scvi.model.MULTIVI.setup_mudata(
    mdata_hvg,
    rna_layer="counts",
    atac_layer="counts",
    batch_key="batch",
    modalities={"rna_layer": "rna", "atac_layer": "atac", "batch_key": "rna"},
)
multivi = scvi.model.MULTIVI(
    mdata_hvg, n_genes=mdata_hvg["rna"].n_vars, n_regions=mdata_hvg["atac"].n_vars
)
multivi.train()
embeddings.obsm["MultiVI"] = multivi.get_latent_representation()
Output
Trainer will use only 1 of 2 GPUs because it is running inside an interactive / notebook environment. You may try to set `Trainer(devices=2)` but please note that multi-GPU inside interactive / notebook environments is considered experimental and unstable. Your mileage may vary.
GPU available: True (cuda), used: True
TPU available: False, using: 0 TPU cores
💡 Tip: For seamless cloud logging and experiment tracking, try installing [litlogger](https://pypi.org/project/litlogger/) to enable LitLogger, which logs metrics and artifacts automatically to the Lightning Experiments platform.
LOCAL_RANK: 0 - CUDA_VISIBLE_DEVICES: [0,1]
Monitored metric reconstruction_loss_validation did not improve in the last 50 records. Best score: 12224.635. Signaling Trainer to stop.
sc.pp.neighbors(embeddings, use_rep="MultiVI")
sc.tl.umap(embeddings)
sc.pl.umap(embeddings, color=["cell_type_l1", "batch"], wspace=0.4)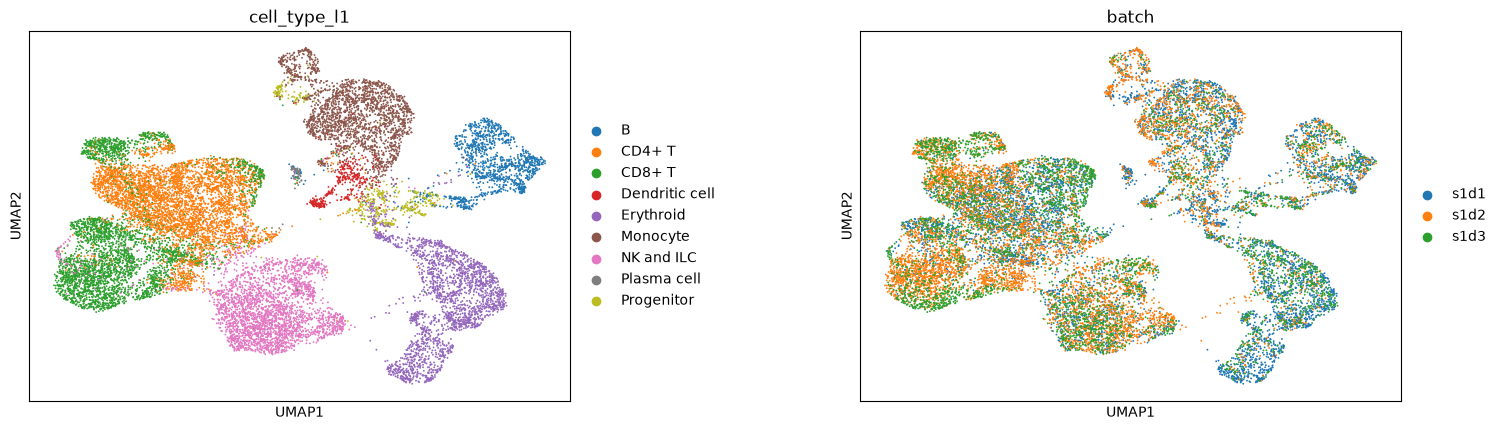
benchmark = Benchmarker(
    embeddings,
    batch_key="batch",
    label_key="cell_type",
    embedding_obsm_keys=["RNA", "ATAC", "MultiVI"],
    pre_integrated_embedding_obsm_key="RNA",
)
benchmark.benchmark()
Output
Computing neighbors: 0%| | 0/3 [00:00<?, ?it/s]Computing neighbors: 33%|███▎ | 1/3 [00:05<00:11, 5.51s/it]Computing neighbors: 67%|██████▋ | 2/3 [00:11<00:05, 5.51s/it]Computing neighbors: 100%|██████████| 3/3 [00:16<00:00, 5.39s/it]Computing neighbors: 100%|██████████| 3/3 [00:16<00:00, 5.42s/it]
Embeddings: 0%| | 0/3 [00:00<?, ?it/s]
Metrics: 0%| | 0/11 [00:00<?, ?it/s]
Metrics: 0%| | 0/11 [00:00<?, ?it/s, Bio conservation: isolated_labels]
Metrics: 9%|▉ | 1/11 [00:01<00:16, 1.63s/it, Bio conservation: isolated_labels]
Metrics: 9%|▉ | 1/11 [00:02<00:16, 1.63s/it, Bio conservation: nmi_ari_cluster_labels_kmeans]
Metrics: 18%|█▊ | 2/11 [00:06<00:32, 3.61s/it, Bio conservation: nmi_ari_cluster_labels_kmeans]
Metrics: 18%|█▊ | 2/11 [00:07<00:32, 3.61s/it, Bio conservation: silhouette_label]
Metrics: 27%|██▋ | 3/11 [00:07<00:20, 2.54s/it, Bio conservation: silhouette_label]
Metrics: 27%|██▋ | 3/11 [00:08<00:20, 2.54s/it, Bio conservation: clisi_knn]
Metrics: 36%|███▋ | 4/11 [00:09<00:13, 1.98s/it, Bio conservation: clisi_knn]
Metrics: 36%|███▋ | 4/11 [00:09<00:13, 1.98s/it, Batch correction: bras]
Metrics: 45%|████▌ | 5/11 [00:17<00:25, 4.24s/it, Batch correction: bras]
Metrics: 45%|████▌ | 5/11 [00:17<00:25, 4.24s/it, Batch correction: ilisi_knn]
Metrics: 55%|█████▍ | 6/11 [00:18<00:15, 3.06s/it, Batch correction: ilisi_knn]
Metrics: 55%|█████▍ | 6/11 [00:18<00:15, 3.06s/it, Batch correction: kbet_per_label]INFO CD8+ T naive consists of a single batch or is too small. Skip.
Metrics: 64%|██████▎ | 7/11 [00:28<00:22, 5.54s/it, Batch correction: kbet_per_label]
Metrics: 64%|██████▎ | 7/11 [00:29<00:22, 5.54s/it, Batch correction: graph_connectivity]
Metrics: 73%|███████▎ | 8/11 [00:29<00:12, 4.01s/it, Batch correction: graph_connectivity]
Metrics: 73%|███████▎ | 8/11 [00:30<00:12, 4.01s/it, Batch correction: pcr_comparison]
Metrics: 82%|████████▏ | 9/11 [00:30<00:06, 3.05s/it, Batch correction: pcr_comparison]Embeddings: 33%|███▎ | 1/3 [00:31<01:02, 31.11s/it]
Metrics: 0%| | 0/11 [00:00<?, ?it/s]
Metrics: 0%| | 0/11 [00:00<?, ?it/s, Bio conservation: isolated_labels]
Metrics: 9%|▉ | 1/11 [00:01<00:13, 1.33s/it, Bio conservation: isolated_labels]
Metrics: 9%|▉ | 1/11 [00:02<00:13, 1.33s/it, Bio conservation: nmi_ari_cluster_labels_kmeans]
Metrics: 18%|█▊ | 2/11 [00:06<00:32, 3.62s/it, Bio conservation: nmi_ari_cluster_labels_kmeans]
Metrics: 18%|█▊ | 2/11 [00:07<00:32, 3.62s/it, Bio conservation: silhouette_label]
Metrics: 27%|██▋ | 3/11 [00:07<00:20, 2.59s/it, Bio conservation: silhouette_label]
Metrics: 27%|██▋ | 3/11 [00:08<00:20, 2.59s/it, Bio conservation: clisi_knn]
Metrics: 36%|███▋ | 4/11 [00:08<00:13, 1.88s/it, Bio conservation: clisi_knn]
Metrics: 36%|███▋ | 4/11 [00:09<00:13, 1.88s/it, Batch correction: bras]
Metrics: 45%|████▌ | 5/11 [00:10<00:10, 1.78s/it, Batch correction: bras]
Metrics: 45%|████▌ | 5/11 [00:11<00:10, 1.78s/it, Batch correction: ilisi_knn]
Metrics: 55%|█████▍ | 6/11 [00:11<00:07, 1.45s/it, Batch correction: ilisi_knn]
Metrics: 55%|█████▍ | 6/11 [00:11<00:07, 1.45s/it, Batch correction: kbet_per_label]INFO CD8+ T naive consists of a single batch or is too small. Skip.
Metrics: 64%|██████▎ | 7/11 [00:21<00:17, 4.49s/it, Batch correction: kbet_per_label]
Metrics: 64%|██████▎ | 7/11 [00:22<00:17, 4.49s/it, Batch correction: graph_connectivity]
Metrics: 73%|███████▎ | 8/11 [00:22<00:09, 3.30s/it, Batch correction: graph_connectivity]
Metrics: 73%|███████▎ | 8/11 [00:23<00:09, 3.30s/it, Batch correction: pcr_comparison]
Metrics: 82%|████████▏ | 9/11 [00:23<00:05, 2.58s/it, Batch correction: pcr_comparison]Embeddings: 67%|██████▋ | 2/3 [00:55<00:27, 27.13s/it]
Metrics: 0%| | 0/11 [00:00<?, ?it/s]
Metrics: 0%| | 0/11 [00:00<?, ?it/s, Bio conservation: isolated_labels]
Metrics: 9%|▉ | 1/11 [00:01<00:10, 1.03s/it, Bio conservation: isolated_labels]
Metrics: 9%|▉ | 1/11 [00:02<00:10, 1.03s/it, Bio conservation: nmi_ari_cluster_labels_kmeans]
Metrics: 18%|█▊ | 2/11 [00:04<00:20, 2.25s/it, Bio conservation: nmi_ari_cluster_labels_kmeans]
Metrics: 18%|█▊ | 2/11 [00:04<00:20, 2.25s/it, Bio conservation: silhouette_label]
Metrics: 27%|██▋ | 3/11 [00:05<00:13, 1.69s/it, Bio conservation: silhouette_label]
Metrics: 27%|██▋ | 3/11 [00:05<00:13, 1.69s/it, Bio conservation: clisi_knn]
Metrics: 36%|███▋ | 4/11 [00:05<00:09, 1.33s/it, Bio conservation: clisi_knn]
Metrics: 36%|███▋ | 4/11 [00:06<00:09, 1.33s/it, Batch correction: bras]
Metrics: 45%|████▌ | 5/11 [00:07<00:08, 1.44s/it, Batch correction: bras]
Metrics: 45%|████▌ | 5/11 [00:08<00:08, 1.44s/it, Batch correction: ilisi_knn]
Metrics: 55%|█████▍ | 6/11 [00:08<00:06, 1.22s/it, Batch correction: ilisi_knn]
Metrics: 55%|█████▍ | 6/11 [00:09<00:06, 1.22s/it, Batch correction: kbet_per_label]INFO CD8+ T naive consists of a single batch or is too small. Skip.
Metrics: 64%|██████▎ | 7/11 [00:18<00:16, 4.03s/it, Batch correction: kbet_per_label]
Metrics: 64%|██████▎ | 7/11 [00:18<00:16, 4.03s/it, Batch correction: graph_connectivity]
Metrics: 73%|███████▎ | 8/11 [00:18<00:08, 2.99s/it, Batch correction: graph_connectivity]
Metrics: 73%|███████▎ | 8/11 [00:19<00:08, 2.99s/it, Batch correction: pcr_comparison]
Metrics: 82%|████████▏ | 9/11 [00:19<00:04, 2.34s/it, Batch correction: pcr_comparison]Embeddings: 100%|██████████| 3/3 [01:16<00:00, 24.16s/it]Embeddings: 100%|██████████| 3/3 [01:16<00:00, 25.36s/it]
_ = benchmark.plot_results_table(min_max_scale=False)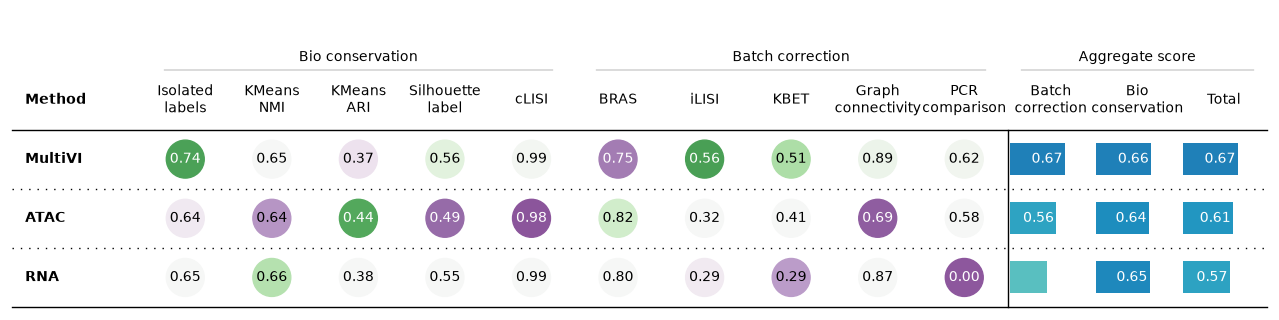
MultiVI mixes the batches better than either modality alone and conserves cell types slightly better, which gives it the best overall score. The gain from adding a second modality is modest in this dataset, whose cell types are already well separated in the RNA.
Contributors
We gratefully acknowledge the contributions of:
Authors
Anastasia Litinetskaya
Reviewers
Lukas Heumos
- Hu, Y., Wan, S., Luo, Y., Li, Y., Wu, T., Deng, W., Jiang, C., Jiang, S., Zhang, Y., Liu, N., Yang, Z., Chen, F., Li, B., & Qu, K. (2024). Benchmarking algorithms for single-cell multi-omics prediction and integration. Nature Methods, 21(11), 2182–2194. 10.1038/s41592-024-02429-w
- Fu, S., Wang, S., Si, D., Li, G., Gao, Y., & Liu, Q. (2025). Benchmarking single-cell multi-modal data integrations. Nature Methods, 22(11), 2437–2448. 10.1038/s41592-025-02737-9
- Liu, C., Ding, S., Kim, H. J., Long, S., Xiao, D., Ghazanfar, S., & Yang, P. (2025). Multitask benchmarking of single-cell multimodal omics integration methods. Nature Methods, 22(11), 2449–2460. 10.1038/s41592-025-02856-3
- Luecken, M. D., Burkhardt, D. B., Cannoodt, R., Lance, C., Agrawal, A., Aliee, H., Chen, A. T., Deconinck, L., Detweiler, A. M., Granados, A. A., Huynh, S., Isacco, L., Kim, Y. J., Klein, D., KUMAR, B. D., Kuppasani, S., Lickert, H., McGeever, A., Mekonen, H., … Bloom, J. M. (2021). A sandbox for prediction and integration of DNA, RNA, and proteins in single cells. Thirty-Fifth Conference on Neural Information Processing Systems Datasets and Benchmarks Track (Round 2). https://openreview.net/forum?id=gN35BGa1Rt
- Hao, Y., Hao, S., Andersen-Nissen, E., Mauck, W. M., Zheng, S., Butler, A., Lee, M. J., Wilk, A. J., Darby, C., Zager, M., Hoffman, P., Stoeckius, M., Papalexi, E., Mimitou, E. P., Jain, J., Srivastava, A., Stuart, T., Fleming, L. M., Yeung, B., … Satija, R. (2021). Integrated analysis of multimodal single-cell data. Cell, 184(13), 3573-3587.e29. 10.1016/j.cell.2021.04.048
- Bredikhin, D., Kats, I., & Stegle, O. (2022). MUON: multimodal omics analysis framework. Genome Biology, 23(1), 42. 10.1186/s13059-021-02577-8
- Argelaguet, R., Arnol, D., Bredikhin, D., Deloro, Y., Velten, B., Marioni, J. C., & Stegle, O. (2020). MOFA+: a statistical framework for comprehensive integration of multi-modal single-cell data. Genome Biology, 21(1), 111. 10.1186/s13059-020-02015-1
- Gayoso, A., Steier, Z., Lopez, R., Regier, J., Nazor, K. L., Streets, A., & Yosef, N. (2021). Joint probabilistic modeling of single-cell multi-omic data with totalVI. Nature Methods, 18(3), 272–282. 10.1038/s41592-020-01050-x
- Luecken, M. D., Büttner, M., Chaichoompu, K., Danese, A., Interlandi, M., Mueller, M. F., Strobl, D. C., Zappia, L., Dugas, M., Colomé-Tatché, M., & Theis, F. J. (2022). Benchmarking atlas-level data integration in single-cell genomics. Nature Methods, 19(1), 41–50. 10.1038/s41592-021-01336-8
- Rautenstrauch, P., & Ohler, U. (2026). Shortcomings of silhouette in single-cell integration benchmarking. Nature Biotechnology, 44(6), 954–958. 10.1038/s41587-025-02743-4
- Ashuach, T., Gabitto, M. I., Koodli, R. V., Saldi, G.-A., Jordan, M. I., & Yosef, N. (2023). MultiVI: deep generative model for the integration of multimodal data. Nature Methods, 20(8), 1222–1231. 10.1038/s41592-023-01909-9
- Martens, L. D., Fischer, D. S., Yépez, V. A., Theis, F. J., & Gagneur, J. (2024). Modeling fragment counts improves single-cell ATAC-seq analysis. Nature Methods, 21(1), 28–31. 10.1038/s41592-023-02112-6