🧠 Key takeaways
Paired receptor and gene expression data link the clonal history and specificity of cells to their state.
Clonotype modularity identifies clonotypes whose cells share a transcriptional state.
Joint embeddings of receptors and gene expression have not been independently benchmarked and should be used to generate hypotheses.
⚙️ Environment setup
Install conda:
Before creating the environment, ensure that conda is installed on your system.
Save the yml content:
Copy the content from the yml tab into a file named
environment.yml.
Create the environment:
Open a terminal or command prompt.
Run the following command:
conda env create -f environment.yml
Activate the environment:
After the environment is created, activate it using:
conda activate <environment_name>Replace
<environment_name>with the name specified in theenvironment.ymlfile. In the yml file it will look like this:name: <environment_name>
Verify the installation:
Check that the environment was created successfully by running:
conda env list
name: air-repertoire
channels:
  - conda-forge
dependencies:
  - conda-forge::ipykernel=7.3.0
  - conda-forge::ipywidgets=8.1.9
  - conda-forge::python=3.13.15
  - conda-forge::scanpy=1.12.4
  - pip
  - pip:
      - lamindb==2.10.0
      - mudata==0.4.1
      - scirpy==0.25.1
🗄️ Get data and notebooks
This book uses lamindb to store, share, and load datasets and notebooks using the theislab/sc-best-practices instance. We acknowledge free hosting from Lamin Labs.
Install lamindb
Install the lamindb Python package:
pip install lamindbOptionally create a lamin account
Sign up and log in following the instructions
Verify your setup
Run the
lamin connectcommand:
import lamindb as ln

ln.Artifact.connect("theislab/sc-best-practices").df()
You should now see up to 100 of the stored datasets.
Accessing datasets (Artifacts)
Search for the datasets on the Artifacts page
Load an Artifact and the corresponding object:
import lamindb as ln

af = ln.Artifact.connect("theislab/sc-best-practices").get(
    key="key_of_dataset", is_latest=True
)
obj = af.load()
The object is now accessible in memory and is ready for analysis. Adapt the
lamindb.Artifact.connect("theislab/sc-best-practices").get("SOMEIDXXXX")suffix to get respective versions.Accessing notebooks (Transforms)
Search for the notebook on the Transforms page
Load the notebook:
lamin load <notebook url>which will download the notebook to the current working directory. Analogously to
Artifacts, you can adapt the suffix ID to get older versions.
Motivation
Paired receptor and gene expression measurements link the clonal history and specificity of a cell to its state. Cells of one clonotype share their antigen and often their fate, which is partly determined by the receptor itself Lagattuta et al., 2022. In the previous chapters, we used the transcriptomic cell types to interpret clonotypes, and here we use the clonotypes to interpret the gene expression.
import warnings

import anndata as ad
import lamindb as ln
import scanpy as sc
import scirpy as ir

warnings.filterwarnings("ignore", category=ad.ExperimentalFeatureWarning)

ln.connect("theislab/sc-best-practices")

ln.track("xCJYwnWzps2W")
Output
→ connected lamindb: theislab/sc-best-practices
! It looks like you are running jupyter lab but don't have jupyter-server module installed. Please install it via pip install jupyter-server
→ loaded Transform('xCJYwnWzps2W0000', key='multimodal_integration.ipynb'), started new Run('xZKKNgqU8dvNwNa9') at 2026-09-29 18:14:11 UTC
→ notebook imports: anndata==0.13.2 lamindb-core==2.10.0 scanpy==1.12.4 scirpy==0.25.1
We load the T cells annotated in the specificity chapter.
mdata_tcr = ln.Artifact.get(
    key="air_repertoire/stephenson2021_tcr_specificity.h5mu"
).load()
Clonotypes in the gene expression space
We normalize the gene expression and build a neighborhood graph on the principal components that the authors corrected for batch effects between the sequencing runs.
gex = mdata_tcr["gex"]
sc.pp.normalize_total(gex)
sc.pp.log1p(gex)
sc.pp.neighbors(gex, use_rep="X_pca_harmony")
sc.tl.umap(gex)
To color the embedding by clonal expansion, we copy it from the airr modality to the gene expression.
gex.obs["clonal_expansion"] = mdata_tcr.obs["airr:clonal_expansion"]
sc.pl.umap(gex, color=["cell_type_coarse", "clonal_expansion"], wspace=0.3)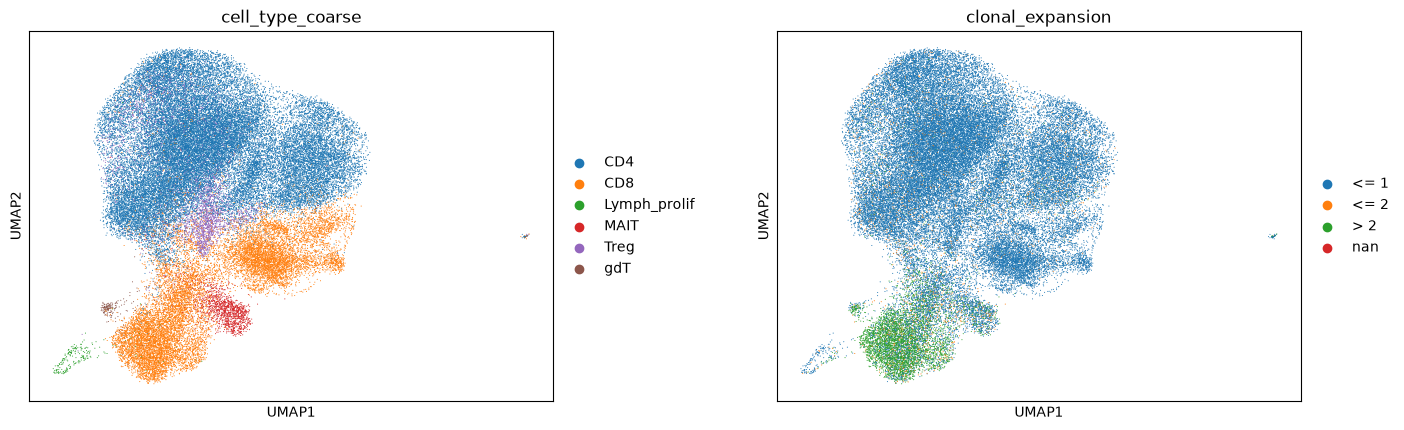
Expanded clonotypes are concentrated in one region of the CD8+ T cells, whereas CD4+ T cells are rarely expanded.
Cells that lack one of the two chains have no clonotype (nan).
Clonotype modularity
Clonotype modularity tests whether the cells of a clonotype are more connected in the neighborhood graph of the gene expression than expected by chance, following the idea of CoNGA Schattgen et al., 2022. Clonotypes with a high modularity share a transcriptional state, whereas clonotypes whose cells are spread across states have differentiated into several fates.
ir.tl.clonotype_modularity(mdata_tcr, target_col="airr:clone_id")
mdata_tcr.pull_obs()
Output
_ = ir.pl.clonotype_modularity(mdata_tcr, base_size=20, show_labels=False)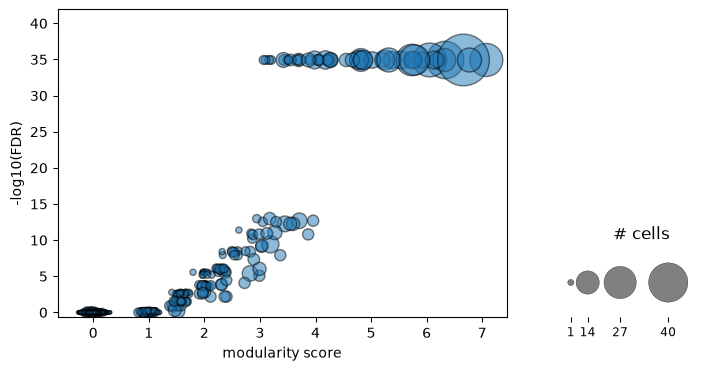
obs = mdata_tcr.obs
modular = obs[obs["airr:clonotype_modularity_fdr"] < 0.1]
modular.groupby("gex:cell_type", observed=True)["airr:clone_id"].nunique().sort_values(
    ascending=False
).head()
gex:cell_type
CD8.TE 148
CD4.CM 84
CD8.EM 83
NKT 38
MAIT 25
Name: airr:clone_id, dtype: int64Most clonotypes with a significant modularity consist of terminal effector or effector memory CD8+ T cells, whose expanded clones share an effector state.
Gene expression of expanded T cells
Groups defined by the receptors can be compared like any other groups of cells. We compare expanded and non-expanded CD8+ T cells.
cd8 = gex[gex.obs["cell_type_coarse"] == "CD8"].copy()
cd8.obs["expanded"] = (cd8.obs["clonal_expansion"] == "> 2").astype(str)
sc.tl.rank_genes_groups(cd8, "expanded", groups=["True"], reference="False")
sc.pl.rank_genes_groups(cd8, n_genes=15)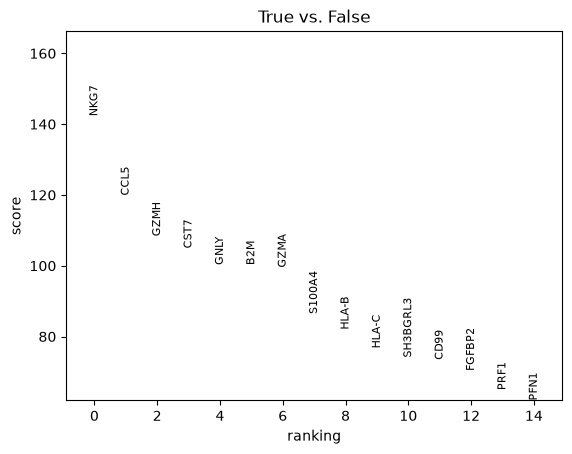
Expanded CD8+ T cells express cytotoxic genes such as NKG7, GZMH, GNLY and PRF1, consistent with their effector state. This comparison treats cells as independent samples, which suffices to characterize groups of cells. Comparisons between conditions, such as severity groups, should instead aggregate the cells of each donor into pseudobulk samples, as described in the differential gene expression chapter Squair et al., 2021.
Joint embeddings
Several methods learn a joint representation of receptor sequences and gene expression. CoNGA relates the neighborhood graphs of TCR and gene expression similarity Schattgen et al., 2022, TESSA and its BCR counterpart Benisse let receptor similarity constrain the expression of clonotypes Zhang et al., 2021Zhang et al., 2022, and mvTCR embeds TCRs and gene expression with a multimodal variational autoencoder Drost et al., 2024. Their authors showed that joint representations capture specificity better than either modality alone, but no independent benchmark of these methods exists yet. We therefore recommend starting with the transparent analyses shown above and using joint embeddings to generate hypotheses, for example about groups of clonotypes that may share an antigen.
Quiz
Contributors
We gratefully acknowledge the contributions of:
Authors
Felix Drost
Reviewers
Lukas Heumos
- Lagattuta, K. A., Kang, J. B., Nathan, A., Pauken, K. E., Jonsson, A. H., Rao, D. A., Sharpe, A. H., Ishigaki, K., & Raychaudhuri, S. (2022). Repertoire analyses reveal T cell antigen receptor sequence features that influence T cell fate. Nature Immunology, 23(3), 446–457. 10.1038/s41590-022-01129-x
- Schattgen, S. A., Guion, K., Crawford, J. C., Souquette, A., Barrio, A. M., Stubbington, M. J., Thomas, P. G., & Bradley, P. (2022). Integrating T cell receptor sequences and transcriptional profiles by clonotype neighbor graph analysis (CoNGA). Nature Biotechnology, 40(1), 54–63.
- Squair, J. W., Gautier, M., Kathe, C., Anderson, M. A., James, N. D., Hutson, T. H., Hudelle, R., Qaiser, T., Matson, K. J. E., Barraud, Q., Levine, A. J., La Manno, G., Skinnider, M. A., & Courtine, G. (2021). Confronting false discoveries in single-cell differential expression. Nature Communications, 12(1), 5692. 10.1038/s41467-021-25960-2
- Zhang, Z., Xiong, D., Wang, X., Liu, H., & Wang, T. (2021). Mapping the functional landscape of T cell receptor repertoires by single-T cell transcriptomics. Nature Methods, 18(1), 92–99.
- Zhang, Z., Chang, W. Y., Wang, K., Yang, Y., Wang, X., Yao, C., Wu, T., Wang, L., & Wang, T. (2022). Interpreting the B-cell receptor repertoire with single-cell gene expression using Benisse. Nature Machine Intelligence, 1–9.
- Drost, F., An, Y., Bonafonte-Pardàs, I., Dratva, L. M., Lindeboom, R. G. H., Haniffa, M., Teichmann, S. A., Theis, F., Lotfollahi, M., & Schubert, B. (2024). Multi-modal generative modeling for joint analysis of single-cell T cell receptor and gene expression data. Nature Communications, 15(1), 5577. 10.1038/s41467-024-49806-9