2. Single-cell RNA sequencing#
Key takeaways
Sequencing evolved from Sanger sequencing to high-throughput NGS to long-read real-time sequencing, which is also called first-, second-, and third-generation sequencing.
ScRNA-Seq allows for the analysis of gene expression at the individual cell level, uncovering cellular heterogeneity and rare cell types that are often masked in bulk RNA-Seq.
In scRNA-Seq, transcript quantification converts the raw data into a table of estimated transcript counts per cell. Full-length protocols capture entire transcripts. Tag-based protocols sequence either the transcripts’ 3’ or 5’ ends.
Transcription takes place in stochastic bursts and leads to a total of 100,000 to 1,000,000 mRNA molecules in a typical mammalian cell.
We categorize scRNA-seq techniques into two broad classes based on cell isolation into droplets (aqueous bubbles) or physical compartments (e.g. wells).
This chapter briefly introduces the most widely used single-cell ribonucleic acid (RNA) sequencing assays and associated basic molecular biology concepts. Multimodal or spatial assays are not covered here but are introduced in the respective advanced chapters. All sequencing assays have individual strengths and limitations, which must be known by data analysts to be aware of possible biases in the data.
2.1. The building block of life#
Life, as we know it, is the characteristic that distinguishes living from dead or inanimate entities. Most definitions of the term life share a common entity - cells. Cells form open systems which maintain homeostasis, have a metabolism, grow, adapt to their environment, reproduce, respond to stimuli, and organize themselves. Therefore, cells are the fundamental building blocks of life, and they were first discovered in 1665 by the British scientist Robert Hooke. Hooke investigated a thin slice of cork with a very rudimentary microscope and, to his surprise, noticed that the slice appeared to resemble a honeycomb. He named these tiny units “cells”.

Fig. 2.1 Robert Hooke’s drawing of cork cells. Image obtained from Micrographia.#
In 1839, Matthias Jakob Schleiden and Theodor Schwann first described Cell Theory, stating that all living organisms are made up of cells. Since the early definition of Cell Theory, researchers have discovered that all cells have almost the same chemical composition and exhibit a dynamic flow of information passing the genetic code from one cell to another in the form of deoxyribonucleic acid (DNA). Two general types of cells exist: eukaryotes and prokaryotes. Eukaryotic cells contain a nucleus, where the nuclear membrane encapsulates the chromosomes; while prokaryotic cells only have a nucleoid region but no nucleus. The nucleus hosts the cells’ genomic DNA, which is why they are called eukaryotes: Nucleus is Latin for kernel or seed. The DNA replication machinery reads the hereditary information that is stored in the DNA in the nucleus to replicate themselves and keep the life cycle going. The eukaryotic DNA is divided into several linear bundles called chromosomes, which are separated by the microtubular spindle during nuclear division. Understanding the hereditary information hidden in DNA is key to understanding many evolutionary and disease-related processes.
Sequencing is the process of deciphering the order of DNA nucleotides. It is primarily used to unveil the genetic information that is carried by a specific DNA segment, a complete genome, or even a complex microbiome. DNA sequencing allows researchers to identify a gene’s location, function, and regulation. For example, it uncovers genetic features such as open reading frames (ORF), the protein-coding sequences between start & stop codons, or CpG islands, which indicate promoter regions. Another widespread application area is evolutionary analysis, where homologous DNA sequences from different organisms are compared. DNA sequencing can additionally be applied for the associations between mutations and diseases or sometimes even disease resistance, deeming it one of the most valuable applications.
2.2. A brief history of sequencing#
2.2.1. First-generation sequencing#
Although DNA was already first isolated in 1869 by Friedrich Miescher, it took the scientific community more than 100 years to develop high-throughput sequencing technologies. In 1953, Watson, Crick, and Franklin discovered the structure of DNA, and in 1965, Robert Holley sequenced the first tRNA. Seven years later, in 1972, Walter Fiers was the first to sequence a complete gene (the coat protein of bacteriophage MS2) using RNases to digest the virus RNA, isolate oligonucleotides and finally separate them with electrophoresis and chromatography [Jou et al., 1972]. In parallel, Frederick Sanger developed a DNA sequencing method using radiolabeled, partially digested fragments termed “chain termination method”, which is more commonly known as “Sanger Sequencing”. Although Sanger Sequencing is still used today, it has suffered from several shortcomings, including lack of automation and being time-consuming. In 1987, Leroy Hood and Michael Hunkapiller developed the ABI 370, an instrument that automates the Sanger Sequencing process. Its most crucial innovative accomplishment was the automatic labeling of DNA fragments with fluorescent dyes instead of radioactive molecules. This change not only made the method safer to perform but also allowed computers to analyze the acquired data [Hood et al., 1987].
Strengths
Sanger sequencing is simple and affordable.
If done correctly, the error rate is very low (<0.001%).
Limitations
Sanger methods can only sequence short pieces of DNA of about 300 to 1000 base pairs.
The quality of a Sanger sequence is often poor in the first 15 to 40 bases because this is where the primers bind.
Sequencing degrades after 700 to 900 bases.
If the sequenced DNA fragment has been cloned, some of the cloning vector sequence (a DNA carrier for copying, storing, and amplifying genes) may find its way into the final sequence.
Sanger sequencing is more expensive than second or third-generation sequencing per sequenced base.
2.2.2. Second-generation sequencing#
Nine years later, in 1996, Mostafa Ronaghi, Mathias Uhlen, and Pȧl Nyŕen revolutionized DNA sequencing by developing pyrosequencing, marking the beginning of second-generation sequencing. Second-generation sequencing, also known as next-generation sequencing (NGS), was primarily made possible by further automation in the lab, the usage of computers, and the miniaturization of reactions. Pyrosequencing measures luminescence that is generated by pyrophosphate synthesis during sequencing. This process is also commonly known as “sequencing-by-synthesis”. Two years later, Shankar Balasubramanian and David Klenerman developed and adapted the sequencing-by-synthesis process for a new method that utilizes fluorescent dyes at the company Solexa. Solexa’s technology also forms the basis of Illumina’s sequencers, which dominate today’s market. The Roche 454 sequencer, developed in 2005, was the first sequencer to fully automate the pyrosequencing process in a single, automated machine. Life Technologies introduced several other platforms, including SOLiD in 2007 (a “sequencing-by-ligation” system) and Ion Torrent in 2011 (detecting hydrogen ions during the synthesis of new DNA). In general, sequencing-by-synthesis involves adding single nucleotides to a growing DNA strand and detecting each addition. At the same time, sequencing-by-ligation relies on detecting the joining of short DNA probes to the fragment to determine the sequence.
Strengths
Second-generation sequencing is often the cheapest option concerning required chemicals.
Sparse material can still be used as input.
High sensitivity to detect low-frequency variants and comprehensive genome coverage.
High capacity with sample multiplexing.
Ability to sequence thousands of genes simultaneously.
Limitations
The sequencing machines are expensive and often must be shared with colleagues.
Second-generation sequencers are big, stationary machines that are not designed for fieldwork.
Generally, second-generation sequencing results in many short sequencing fragments (reads) that are hard to use for novel genomes.
The quality of the sequencing result depends on the reference genome.
2.2.3. Third-generation sequencing#
The third generation of sequencing, nowadays also known as next-generation sequencing, has brought two innovations to the market. First, long-read sequencing, which enables the detection of nucleotide fragments that are much longer than those generated by second-generation sequencing. The typical Illumina short-read sequencers generate fragments ranging from 75 to 300 base pairs, depending on the model. With third-generation sequencing, sequencers can read tens of thousands of base pairs. This is especially important for the assembly of novel genomes without an available reference genome. Second, the ability to sequence in real-time is another major advancement in third-generation sequencing. Combined with portable sequencers, which are small in size and do not require further complex machines for the chemistry, sequencing is now “field-ready” and can be used even far away from laboratory facilities to collect samples.
A note on sequencing length
1 base pair (bp)
1 kilo base pair (kb) = 1,000 bp
1 mega base pair (Mb) = 1,000,000 bp
1 giga base pair (Gb) = 1,000,000,000 bp
Pacific Biosciences (PacBio) introduced zero-mode waveguide sequencing in 2010, which uses so-called nanoholes containing a single DNA polymerase. This allows the incorporation of any single nucleotide to be directly observed by detectors attached below the nanoholes. Each type of nucleotide is labeled with a specific fluorescent dye that emits fluorescent signals during the incorporation process, which are subsequently measured as sequence readout. Reads obtained from PacBio sequencers are usually 8 to 15 kb, with possibilities for up to 70 kb.
Oxford Nanopore Technologies first introduced the portable MinION device in 2012. The MinION and its successors, GridION and PromethION product line, are sequencers for DNA/RNA capable of producing reads of more than 2 Mb. Typically, nanopore single-cell libraries produce cDNA transcripts of lengths usually 900 bp to 2.7 kb. Notably, the MinION sequencing device is small enough to fit in the palm of a hand. The idea of Oxford Nanopore sequencers is to detect changes in the electrical current as nucleic acids migrate through protein nanopores [Jain et al., 2016].
Strengths
Long reads will allow for the assembly of large novel genomes.
Sequencers are portable, making them ideal for fieldwork.
Possibility to directly detect epigenetic modifications of DNA and RNA sequences.
Speed! Third-generation sequencers are fast.
Limitations
Some third-generation sequencers exhibit higher error rates than second-generation sequencers (Roche’s new sequencing by expansion technology, for example, attempts to solve this problem [Jain et al., 2016] [Roche, 2025]).
The reagents are generally more expensive than second-generation sequencing.
Comparison of sequencing technologies across generations
Name |
Max read length (kb) |
Accuracy (%) |
Cost ($/Gb) |
Throughput (Mb/year) |
Generation |
|---|---|---|---|---|---|
Illumina NextSeq 550 |
0.15 |
>99.9 |
>47,782 |
50-63 |
2 |
Illumina NovaSeq 6000 |
0.25 |
>99.9 |
10-35 |
>1,194,545 |
2 |
Sanger sequencing (e.g. ThermoFisher) |
1b |
99.99a |
500,000c |
0.73d |
1 |
PacBio (Sequel II, HiFi) |
>20 |
>99 |
43–86 |
10,220 |
3 |
PacBio (Sequel II, CLR) |
>200 |
87–92 |
13-26 |
93,440 |
3 |
Nanopore (PromethION) |
>1,000 |
87–98 |
21-42 |
3,153,600 |
3 |
Nanopore (MinION/GridION) |
>1,500 |
87–98 |
50-2,000 |
913-109,500 |
3 |
2.3. Overview of the NGS process#
Even though a variety of NGS technologies exist, the general steps to sequence DNA (and therefore reverse transcribed RNA) are largely the same. The differences lie primarily in the chemistry of the respective sequencing technologies.
Sample and library preparation: As a first step, a so-called library is prepared by fragmenting the DNA samples and ligating them with adapter molecules. These adapters participate in the hybridization of the library fragments to the matrix and form a priming site.
Amplification and sequencing: In the second step, the library gets converted into single-strand molecules. During an amplification step (such as a polymerase chain reaction), clusters of DNA molecules are created. All of the clusters perform individual reactions during a single sequencing run.
Data output and analysis: The output of a sequencing experiment depends on the sequencing technology and chemistry. Some sequencers generate fluorescence signals, which are stored in specific output files. Others may generate electric signals, which are stored in corresponding file formats. Generally, the amount of generated data, the raw data, is huge. Such data requires complex and computationally heavy processing. This is further discussed in the raw data processing chapter.
2.4. RNA sequencing#
So far, we have only introduced sequencing with the unmentioned assumption that the DNA is being sequenced. However, knowing the DNA sequence of an organism and the positions of its regulatory elements tells us very little about a cell’s dynamic and real-time processes. RNA sequencing (RNA-Seq) allows scientists to obtain snapshots of cells, tissues, or organisms at the time of sequencing in the form of expression profiles of genes. This information can be used to detect changes in disease states in response to therapeutics, environmental factors, genotypes, and other experimental conditions.
RNA-Seq largely follows the DNA sequencing protocols but includes a reverse transcription step where complementary DNA (cDNA) is synthesized from the RNA template. Modern RNA sequencing allows for an unbiased sampling of transcripts in contrast to, for example, microarray-based assays or quantitative reverse transcription PCR, which require probe design to specifically target the regions of interest. Microarray-based assays use probes, complementary sequences, to detect specific sequences (e.g. genes) of interest. Quantitative reverse transcription PCR measures the amount of target RNA by monitoring the amplification of a complementary DNA (cDNA) molecule during PCR.
The obtained gene expression profiles further enable the detection of gene isoforms, gene fusions, single nucleotide variants, and many other interesting properties. Modern RNA sequencing is not limited by prior knowledge and allows for the capture of both known and novel features. This results in rich data sets that can be used for exploratory data analysis.
2.5. Single-cell RNA sequencing#
2.5.1. Bulk sequencing vs single-cell RNA sequencing#
RNA-Seq can be mainly conducted in two ways: Either by sequencing the mixed RNA from the source of interest across cells (bulk sequencing) or by sequencing the transcriptomes of the cells individually (single-cell sequencing). Mixing the RNA of all cells is, in most cases, cheaper and easier than experimentally complex single-cell RNA-Seq (scRNA-Seq) Bulk RNA-Seq results in cell-averaged expression profiles, which are generally easier to analyze, but also hide some of the complexity, such as cell expression profile heterogeneity, which may help answer the question of interest. Some drugs or perturbations may affect only specific cell types or interactions between cell types. For example, in oncology, it is possible to have rare drug-resistant tumor cells causing relapse, which is difficult to identify by simple bulk RNA-Seq, even on cultured cells.
To uncover such relationships, examining gene expression on a single-cell level is vital. ScRNA-Seq does, however, come with several caveats. First, single-cell experiments are generally more expensive and more difficult to properly conduct. Second, the downstream analysis becomes more complex due to the increased resolution, and it is easier to draw false conclusions.
A single-cell experiment generally follows similar steps as a bulk RNA-Seq experiment (see above) but requires several adaptations. Like bulk sequencing, single-cell sequencing requires lysis, reverse transcription, amplification, and eventual sequencing. In addition, single-cell sequencing requires cell isolation and a physical separation into smaller reaction chambers or another form of cell labeling to be able to map the obtained transcriptomes back to the cells of origin later on. Hence, these are also the steps where most single-cell assays differ: single-cell isolation, transcript amplification, and sequencing, depending on the sequencing machine. But before we can start explaining the intricacies of single-cell RNA sequencing, it’s essential to understand the biological and technical challenges that arise when measuring mRNA at such a fine resolution.
2.5.2. Quantifying gene expression#
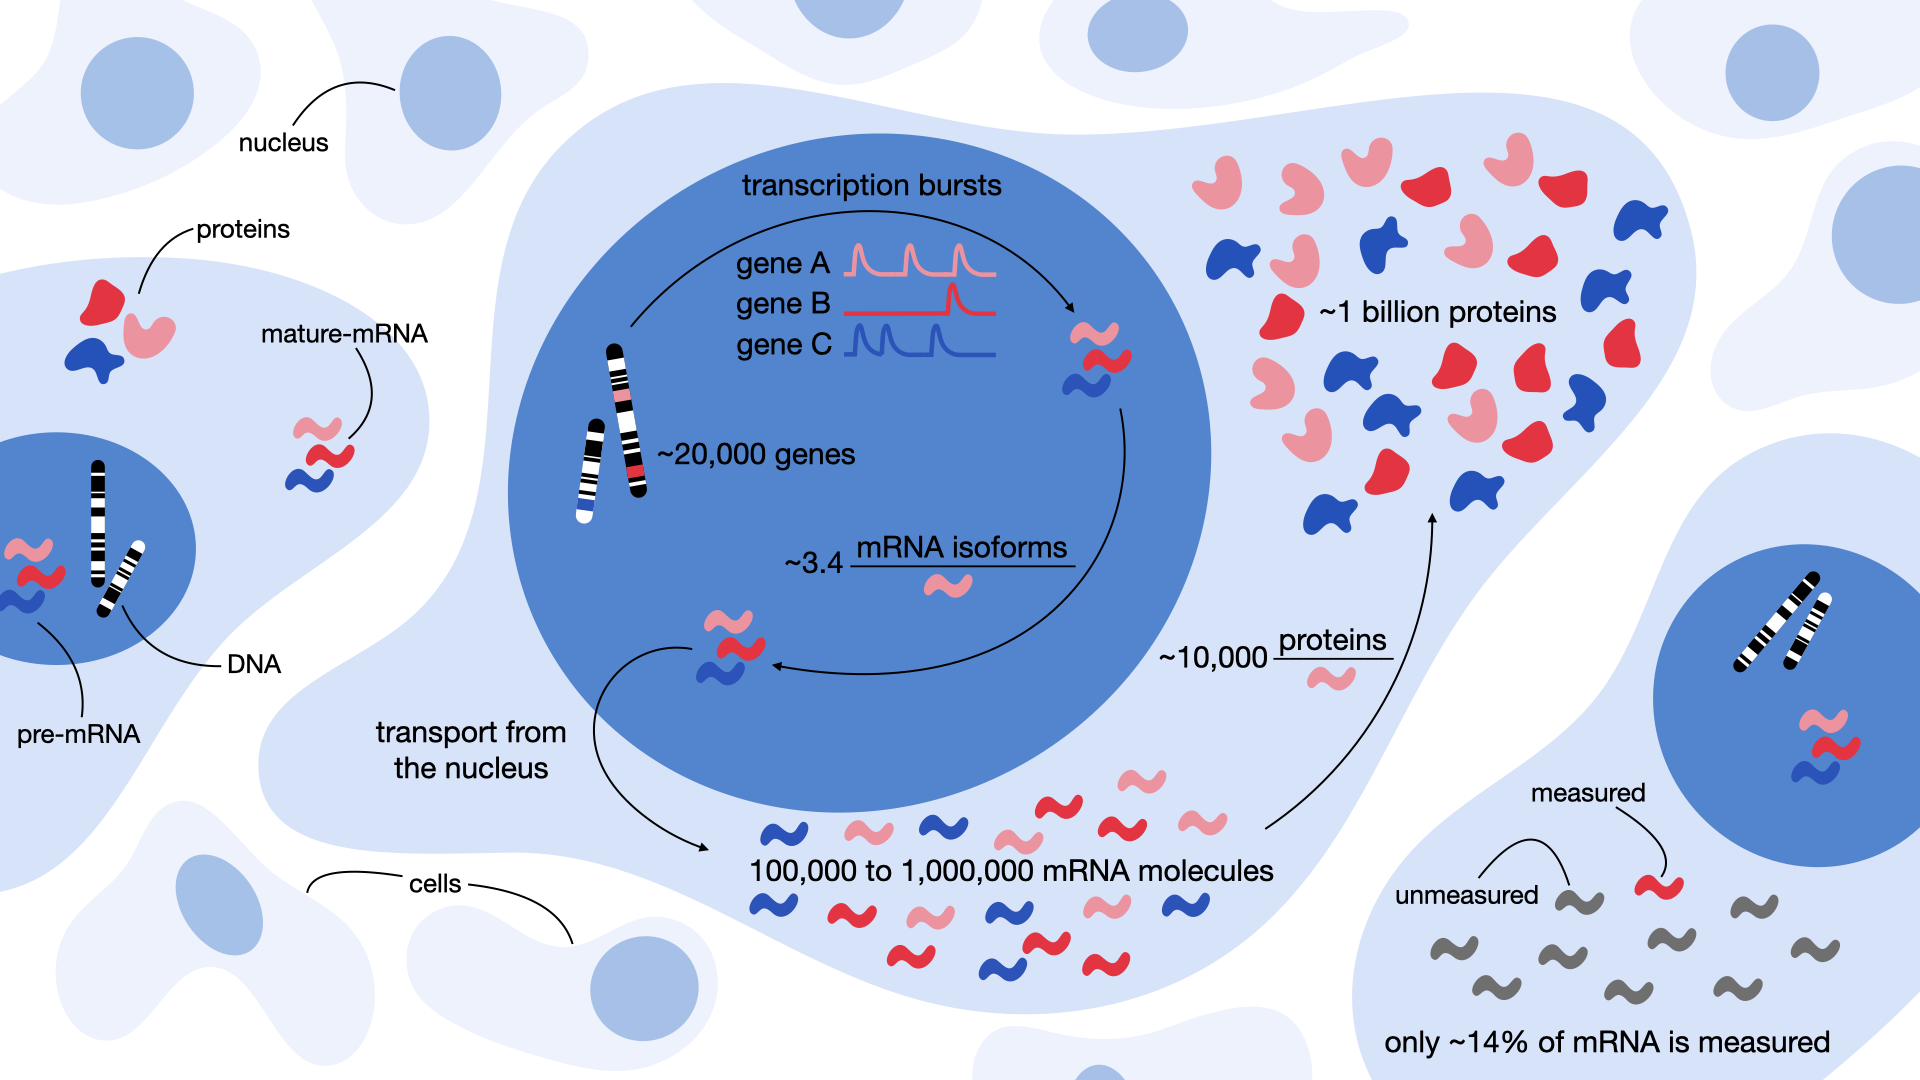
Fig. 2.2 Quantifying gene expression from transcriptional bursts to protein production. These values are approximations intended to give a general impression and may vary depending on the context or in the future.#
2.5.2.1. Measuring “messengers”#
At the core of scRNA-Seq lies a fundamental question: What exactly are we trying to measure? In RNA-seq experiments, our focus is on quantifying messenger RNA (mRNA) within individual cells. This molecule is “an unstable intermediate that carries information from genes to ribosomes for protein synthesis” as Brenner, Jacob and Meselson described it in 1961 and thus coined the term “messenger” [Brenner et al., 1961]. Therefore, mRNA serves as the crucial link between DNA and protein production. Yet, mRNA makes up only a small fraction of a cell’s total RNA. Roughly 3–7% of RNA mass is mRNA, while the overwhelming majority is non-coding RNA: 80–90% ribosomal RNA (rRNA), 10–15% transfer RNA (tRNA), and ~1% other non-coding species [Palazzo and Lee, 2015] (overview of non-coding RNA). Estimates suggest there are between 100,000 to 1,000,000 mRNA molecules in a typical mammalian cell, covering up to ~50% of all genes [Islam et al., 2014, Velculescu et al., 1999]. This means that a notable number of genes are not transcribed at all in any given cell — a reflection of the cell’s specific identity and function. However, technical limitations in current scRNA-seq technologies further complicate measurement. For example, popular platforms like 10X Genomics capture only up to 65% of cells per run and recover just ~14% of each cell’s mRNA [AlJanahi et al., 2018]. These constraints make it especially challenging to detect weakly expressed genes.
Understanding the gene expression through these numerical lenses reveals not only the biological complexity but also the limitations of our tools (Fig. 2.2). To appreciate this more deeply, let’s walk step by step from gene to protein.
2.5.2.2. From Gene to Protein#
Our journey begins with a gene, a defined region in the DNA that acts as a template for mRNA synthesis. While the number of genes can vary slightly between individuals (~70 genes), the average human genome contains roughly 22,000 genes [Pertea and Salzberg, 2010]. Gene transcription is far from continuous. Instead, it occurs in stochastic bursts — short, irregular periods of activity during which a gene might suddenly produce multiple mRNA transcripts before returning to silence [Suter et al., 2011]. This is also the reason why we model mRNA transcription with a negative binomial distribution. This distribution is ideal because it models event counts (mRNA) while capturing overdispersion (variance exceeding the mean) caused by transcriptional bursts [Love, 2015, Ren and Kuan, 2020].
The initial RNA transcript, known as pre-mRNA, then undergoes alternative splicing, a process that allows different regions (called introns and exons) of the transcript to be joined in multiple ways. This means that a single gene can give rise to multiple distinct mRNA isoforms. On average, each human gene produces about 3.4 mRNA isoforms [Lee and Rio, 2015]. While all human genes have at least two alternative isoforms, some push the limits of complexity. The human basonuclin 2 gene, for instance, has the potential to generate up to 90,000 mRNA isoforms, resulting in over 2,000 different proteins [Vanhoutteghem and Djian, 2007]. In some cases, however, alternative splicing could also lead to a non-functioning enzyme and an induced disease state. Finally, this “mature” mRNA is translated into proteins. Here, too, the numbers vary dramatically. In mammals, the median protein-to-mRNA ratio is estimated to be around 10,000 proteins per mRNA [Li et al., 2014]. However, this can range from just a few hundred to nearly a million proteins per transcript, depending on the gene, cell type and many other factors [Edfors et al., 2016]. Ultimately, this process results in approximately one billion proteins within a single human cell [Milo, 2013].
Understanding these layers — from transcriptional bursts and alternative splicing to protein translation — highlights how gene expression is not just a static pathway, but a dynamic and probabilistic system. Measuring it at single-cell resolution offers profound insights, but also reveals the challenges and limits of our current technologies.
2.5.3. Transcript quantification#
Transcript quantification is the process of converting the raw data into a table of estimated transcript counts per gene per sample (for bulk sequencing) or per cell (for single-cell sequencing). More details on this computational process will be described in the next chapter.
There are two major approaches to transcript quantification: full-length and tag-based. Full-length protocols try to cover the whole transcript uniformly with sequencing reads, whereas tag-based protocols only capture the 5’ or 3’ ends. The transcript quantification method has strong implications on the captured genes, and analysts must therefore be aware of the used quantification process. Full-length sequencing is restricted to plate-based protocols (see below), and the library preparation is comparable to bulk RNA-seq sequencing approaches. An even coverage of transcripts is not always achieved with full-length protocols, and therefore specific regions across the gene body may still be biased. A major advantage of full-length protocols is that they allow for the detection of splice variants.
Tag-based protocols only sequence either the transcripts’ 3’ or 5’ end. This comes at the cost of not (necessarily) covering the full gene length, making it difficult to unambiguously align reads to a transcript and distinguishing between different isoforms [Archer et al., 2016]. However, it allows for the usage of unique molecular identifiers (UMIs), which are useful to resolve biases in the transcript amplification process.
The transcript amplification process is a critical step in any RNA-seq sequencing run to ensure that the transcripts are abundant enough for quality control and sequencing. During this process, which is typically conducted with polymerase chain reaction (PCR), copies are made from identical fragments of the original molecule. Since the copies and the original molecules are indistinguishable, determining the original number of molecules in samples becomes challenging. UMIs are a common solution for quantifying original, non-duplicated molecules.
UMIs serve as molecular barcodes and are sometimes called random barcodes. These ‘barcodes’ consist of short random nucleotide sequences that are added to every molecule in the sample as a unique tag. UMIs must be added during library generation before the amplification step. Accurately identifying PCR duplicates is important for downstream analysis to rule out - or be aware of amplification biases [Aird et al., 2011].
Amplification bias is a term for the RNA/cDNA sequences that are preferentially amplified and will therefore be sequenced more often, resulting in higher counts. It can harm any gene expression analysis because the not-very-active genes may suddenly appear to be highly expressed. This is especially true for sequences that are amplified at a later stage of the PCR step, where the error rate may already be comparably higher than earlier PCR stages. Although it is computationally possible to detect and remove such sequences by filtering out reads with identical alignment coordinates, it is generally advised to always design the experiment with UMIs, if possible. Using UMIs further allows for normalizing gene counts without a loss of accuracy [Kivioja et al., 2012].
2.5.4. Single-cell sequencing protocols#
Numerous protocols exist for sequencing the transcriptomes of individual cells. However, the terminology can often be ambiguous, especially for those new to the field. To clarify, we categorize these techniques into two broad classes based on how cells are isolated:
Separation in droplets: These methods encapsulate individual cells into tiny droplets within an emulsion, enabling high-throughput processing.
Separation in physical compartments: These techniques isolate cells into distinct physical compartments, often referred to as wells.
Each approach differs in the ability to recover transcripts, the number of sequenced cells, and many other aspects. In the following subsections, we will briefly discuss how they work, their strengths and weaknesses, and possible biases that data analysts should be aware of regarding the respective protocols.
2.5.4.1. Separation in Droplets#
2.5.4.1.1. Most common protocols#
The most widely used protocols are inDrop [Klein et al., 2015], Drop-seq [Macosko et al., 2015] and the commercially available 10x Genomics Chromium [Zheng et al., 2017]. These protocols use microfluids to trap cells in tiny, watery bubbles known as droplets. Each droplet forms a separate space containing only one cell and the required chemicals (beads). The mentioned protocols can generate droplets thousands of times per second. This massively parallel process generates very high numbers of droplets for a relatively low cost.
Droplets by vortexing
The PIP-seq protocol offers a simplified alternative to traditional microfluidic methods for generating monodispersed water-in-oil droplets. Unlike complex microfluidic devices that require specialized equipment and expertise, PIP-seq achieves droplet formation through simple vortexing of the solution. This method can be easily scaled by increasing the container volume without being constrained by emulsion time, a common limitation of microfluidics [Clark et al., 2023].
However, despite its simplicity, independent benchmarks indicate that PIP-seq still has limitations compared to well-established methods. For instance, PIP-seq achieved approximately 1,500 gene counts, whereas the best 10x Genomics Chromium kit showed around 4,000 gene counts [De Simone et al., 2025]. These findings highlight a trade-off between ease of use and performance in the current version of the PIP-seq protocol.
Although all three protocols differ in detail, nanoliter-sized droplets containing encapsulated cells are always designed to capture beads and cells simultaneously. The encapsulation process is conducted with specialized microbeads with on-bead primers containing a PCR handle, a cell barcode, and a 4-8b base pairs-long UMI and a poly-T tail (or in the case of a 5’ kit, there will be a poly-T primer). Upon lysis, the cell’s mRNA is instantaneously released and captured by the barcoded oligonucleotides that are attached to the beads. Next, the droplets are collected and broken to release single-cell transcriptomes attached to microparticles (STAMPs). This is followed by PCR and reverse transcription to capture and amplify the transcripts. Finally, tagmentation takes place where the transcripts are randomly cut and sequencing adaptors get attached. This process results in sequencing libraries that are ready for sequencing, as described above. In droplet-based protocols, only about 10% of cell transcripts are recovered [Islam et al., 2014]. Notably, this low sequencing is sufficient for a robust identification of cell types.
All three methods result in characteristic biases. The material of the used beads differs between the protocols. Drop-seq uses brittle resin for the bead. Therefore, the beads are encapsulated with a Poisson distribution, whereas the InDrop and 10X Genomics beads are deformable resulting in bead occupancies of over 80% [Zhang et al., 2019].
Moreover, capture efficiency is likely influenced by the use of surface-tethered primers in Drop-Seq. InDrop uses primers that are released with photocleavage, and 10X genomics dissolves the beads. This disparity also affects the location of the reverse transcription process. In Drop-seq, reverse transcription occurs after the beads are released from the droplets, while reverse transcription takes place inside the droplets for the InDrop and 10X genomics protocols [Zhang et al., 2019].
A comparison from Zhang et al. in 2019 uncovered that inDrop and Drop-seq are outperformed by 10X Genomics with respect to bead quality, as the cell barcodes in the former two systems contained obvious mismatches. Moreover, the proportion of reads originating from valid barcodes was 75% for 10X Genomics, compared to only 25% for InDrop and 30% for Drop-seq.
Similar advantages regarding sensitivity were demonstrated for 10X Genomics. During their comparison, 10X Genomics captured about 17000 transcripts from 3000 genes on average, compared to 8000 transcripts from 2500 genes for Drop-seq and 2700 transcripts from 1250 genes for InDrop. Technical noise was the lowest for 10X Genomics, followed by Drop-seq and InDrop [Zhang et al., 2019].
The actual generated data demonstrated large protocol biases. 10X Genomics favored the capture and amplification of shorter genes and genes with higher GC content, while Drop-seq, in comparison, preferred genes with lower GC content. Although 10X Genomics was shown to outperform the other protocols in various aspects, it is also about twice as expensive per cell. Moreover, except the beads, Drop-seq is open-source and the protocol can more easily be adapted if required. InDrop is completely open-source, where even the beads can be manufactured and modified in labs. Hence, InDrop is the most flexible of the three protocols.
Strengths
Allows for the cost-efficient sequencing of cells in large quantities to identify the overall composition of a tissue and characterize rare cell types.
UMIs can be incorporated.
Limitations
Low detection rates of transcripts compared to other methods.
Captures only 3’ ends (or 5’ ends, depending on kit) and not full transcripts.
2.5.4.1.2. Nanopore sequencing meets droplet technology#
Long-read single-cell sequencing approaches rarely use UMI [Singh et al., 2019] or do not perform UMI correction [Gupta et al., 2018] and therefore misassign some reads to novel UMIs. Due to the higher sequencing error rate of long-read sequencers, this causes serious issues [Lebrigand et al., 2020]. Lebrigand et al. introduced ScNaUmi-seq (Single-cell Nanopore sequencing with UMIs), combining Nanopore sequencing with cell barcode and UMI assignment. The barcode assignment is guided with Illumina data by comparing the cell bar code sequences found in the Nanopore reads with those recovered from the Illumina reads for the same region or gene [Lebrigand et al., 2020]. However, this effectively requires two single-cell libraries. ScCOLOR-seq computationally identifies barcodes without errors using nucleotide pair complementary across the full length of the barcode. These barcodes are then used as guides to correct the remaining erroneous barcodes [Philpott et al., 2021]. A modified UMI-tools directional network-based method corrects for UMI sequence duplication.
Strengths
Recovers splicing and sequence heterogeneity information
Limitations
Nanopore reagents are expensive.
High cell barcode recovery error rates.
Depending on the protocol, barcode assignment is guided with Illumina data requiring two sequencing assays.
2.5.4.2. Separation in physical compartments#
2.5.4.2.1. Plate-based protocols#
Typically, plate-based protocols physically separate the cells into microwell plates. The first step entails cell sorting by, for example, fluorescent-activated cell sorting (FACS), where cells are sorted according to specific cell surface markers; or by micro pipetting. The selected cells are then placed into individual wells containing cell lysis buffers. A reverse transcription is then carried out in these wells. This allows several hundred cells to be analyzed in a single experiment with 5000 to 10000 captured genes each.
Plate-based sequencing protocols include but are not limited to, SMART-seq2, MARS-seq, QUARTZ-seq, and SRCB-seq. Generally speaking, the protocols differ in their multiplexing ability. For example, MARS-seq allows for three barcode levels, namely molecular, cellular, and plate-level tags, for robust multiplexing capabilities. SMART-seq2, on the contrary, does not allow for early multiplexing, limiting cell numbers. A systematic comparison of protocols by Mereu et al. in 2020 revealed that QUARTZ-seq2 can capture more genes than SMART-seq2, MARS-seq, or SRCB-seq per cell [Mereu et al., 2020]. This means QUARTZ-seq2 can capture cell-type specific marker genes well, allowing for confident cell-type annotation.
Strengths
Recovers many genes per cell, allowing for a deep characterization.
It is possible to gather information before the library preparation, e.g., through FACS sorting to associate information such as cell size and the intensity of any used labels with good coordinates.
Allows for full-length transcript recovery.
Limitations
The scale of plate-based experiments is limited by the lower throughput of their individual processing units.
Fragmentation step eliminates strand-specific information [Hrdlickova et al., 2017].
Depending on the protocol, plate-based protocols might be labor-intensive with many required pipetting steps, leading to potential technical noise and batch effects.
2.5.4.2.2. Fluidigm C1#
The commercial Fluidigm C1 system is a microfluidic chip that loads and separates cells into small reaction chambers in an automated manner. The CEL-seq2 and SMART-seq (version 1) protocols use the Fluidigm C1 chips in their workflow, allowing the RNA extraction and library preparation steps to be conducted together, thereby decreasing the required manual labor. However, the Fluidigm C1 requires rather homogeneous cell mixtures since the cells will reach different locations on the microfluidic chip based on their size, which could introduce potential location bias. Full-length sequencing is possible since the amplification step is carried out in individual wells, effectively reducing the 3’ bias of many other single-cell RNA-seq sequencing protocols. The protocol is generally also more expensive and is therefore primarily useful for an extensive examination of a specific cell population.
Strengths
Allows for full-length transcript coverage.
Splicing variants and T/B cell receptor repertoire diversity can be recovered.
Limitations
Only allows for the sequencing of up to 800 cells [Fluidigm, 2022].
More expensive per cell than other protocols.
Only about 10% of the extracted cells are captured, which makes this protocol unsuitable for rare cell types or low input.
The used arrays only capture specific cell sizes, which may bias the captured transcripts.
2.5.4.3. Summary#
In summary, we strongly recommend that wet lab and dry lab scientists select the sequencing protocol based on the aim of the study. Is a deep characterization of a specific cell type population desired? In this case, one of the plate-based methods may be more suitable. On the contrary, droplet-based assays will capture heterogeneous mixtures better, allowing for a broader characterization of the sequenced cells. Moreover, if the budget is a limiting factor, the protocol of choice should be more cost-effective and robust. When analyzing the data, be aware of the sequencing assay-specific biases. For an extensive comparison of all single-cell sequencing protocols, we recommend the “Benchmarking single-cell RNA-sequencing protocols for cell atlas projects” paper by Mereu et al. [Mereu et al., 2020].
2.5.5. Single-cell vs single-nuclei#
So far, we have only been discussing single-cell assays, but it is also possible to sequence only the nuclei of the cells. Single-cell profiling does not always provide an unbiased view of cell types for specific tissues or organs, such as, for example, the brain. During the tissue dissociation process, some cell types are more vulnerable and therefore difficult to capture. For example, fast-spiking parvalbumin-positive interneurons and subcortically projecting glutamatergic neurons were observed in lower proportions than expected in mouse neocortex [Tasic et al., 2018]. On the contrary, non-neuronal cells survive dissociation better than neurons and are overrepresented in single-cell suspensions in the adult human neocortex [Darmanis et al., 2015]. Moreover, single-cell sequencing highly relies on fresh tissue, making it difficult to use tissue biobanks. On the other hand, the nuclei are more resistant to mechanical force and can be safely isolated from frozen tissue without the use of tissue dissociation enzymes [Krishnaswami et al., 2016]. Both options have varying applicability across tissues and sample types, and the resulting biases and uncertainties are still not fully uncovered. It has been shown already that nuclei accurately reflect all transcriptional patterns of cells [Ding et al., 2020]. The choice of single-cell versus single-nuclei in the experimental design is mostly driven by the type of tissue sample. Data analysis, however, should be aware of the fact that dissociation ability will have a strong effect on the potentially observable cell types. Therefore, we strongly encourage discussions between wet lab and dry lab scientists concerning the experimental design.
See also
To get a more elaborate understanding of the experimental assays, we recommend the following papers:
Comparative Analysis of Single-Cell RNA Sequencing Methods [Ziegenhain et al., 2017]
Power analysis of single-cell RNA-sequencing experiments [Svensson et al., 2017]
Single-nucleus and single-cell transcriptomes compared in matched cortical cell types [Bakken et al., 2018]
Guidelines for the experimental design of single-cell RNA sequencing studies [Lafzi et al., 2018]
Benchmarking single-cell RNA-sequencing protocols for cell atlas projects [Mereu et al., 2020]
Direct Comparative Analyses of 10X Genomics Chromium and Smart-seq2 [Wang et al., 2021]
Videos for laboratory methods:
Others:
2.5.6. Questions#
2.5.6.1. Flipcards#
2.5.6.2. Multiple choice questions#
What is the primary purpose of scRNA-seq?
What is reverse transcription in the context of scRNA-seq?
What is the main difference between single-cell and single-nuclei sequencing?
Which of the following best describes PIP-seq?
2.6. References#
Daniel Aird, Michael G. Ross, Wei-Sheng Chen, Maxwell Danielsson, Timothy Fennell, Carsten Russ, David B. Jaffe, Chad Nusbaum, and Andreas Gnirke. Analyzing and minimizing pcr amplification bias in illumina sequencing libraries. Genome Biology, 12(2):R18, Feb 2011. URL: https://doi.org/10.1186/gb-2011-12-2-r18, doi:10.1186/gb-2011-12-2-r18.
Aisha A AlJanahi, Mark Danielsen, and Cynthia E Dunbar. An introduction to the analysis of single-cell rna-sequencing data. Molecular Therapy Methods & Clinical Development, 10:189–196, 2018. URL: https://www.cell.com/molecular-therapy-family/methods/fulltext/S2329-0501(18)30066-4, doi:10.1016/j.omtm.2018.07.003.
Nathan Archer, Mark D. Walsh, Vahid Shahrezaei, and Daniel Hebenstreit. Modeling enzyme processivity reveals that rna-seq libraries are biased in characteristic and correctable ways. Cell Systems, 3(5):467–479.e12, 2016. URL: https://www.sciencedirect.com/science/article/pii/S2405471216303313, doi:https://doi.org/10.1016/j.cels.2016.10.012.
Trygve E. Bakken, Rebecca D. Hodge, Jeremy A. Miller, Zizhen Yao, Thuc Nghi Nguyen, Brian Aevermann, Eliza Barkan, Darren Bertagnolli, Tamara Casper, Nick Dee, Emma Garren, Jeff Goldy, Lucas T. Graybuck, Matthew Kroll, Roger S. Lasken, Kanan Lathia, Sheana Parry, Christine Rimorin, Richard H. Scheuermann, Nicholas J. Schork, Soraya I. Shehata, Michael Tieu, John W. Phillips, Amy Bernard, Kimberly A. Smith, Hongkui Zeng, Ed S. Lein, and Bosiljka Tasic. Single-nucleus and single-cell transcriptomes compared in matched cortical cell types. PLOS ONE, 13(12):1–24, 12 2018. URL: https://doi.org/10.1371/journal.pone.0209648, doi:10.1371/journal.pone.0209648.
Sydney Brenner, François Jacob, and Matthew Meselson. An unstable intermediate carrying information from genes to ribosomes for protein synthesis. Nature, 190:576–581, 1961. URL: https://www.nature.com/articles/190576a0, doi:10.1038/190576a0.
Iain C Clark, Kristina M Fontanez, Robert H Meltzer, Yi Xue, Corey Hayford, Aaron May-Zhang, Chris D’Amato, Ahmad Osman, Jesse Q Zhang, Pabodha Hettige, and others. Microfluidics-free single-cell genomics with templated emulsification. Nature Biotechnology, 41(11):1557–1566, 2023. doi:10.1038/s41587-023-01685-z.
Spyros Darmanis, Steven A. Sloan, Ye Zhang, Martin Enge, Christine Caneda, Lawrence M. Shuer, Melanie G. Hayden Gephart, Ben A. Barres, and Stephen R. Quake. A survey of human brain transcriptome diversity at the single cell level. Proceedings of the National Academy of Sciences, 112(23):7285–7290, 2015. URL: https://www.pnas.org/doi/abs/10.1073/pnas.1507125112, arXiv:https://www.pnas.org/doi/pdf/10.1073/pnas.1507125112, doi:10.1073/pnas.1507125112.
Marco De Simone, Jonathan Hoover, Julia Lau, Hayley M Bennett, Bing Wu, Cynthia Chen, Hari Menon, Amelia Au-Yeung, Sean Lear, Samir Vaidya, and others. A comprehensive analysis framework for evaluating commercial single-cell rna sequencing technologies. Nucleic Acids Research, 53(2):gkae1186, 2025. URL: https://academic.oup.com/nar/article/53/2/gkae1186/7924191, doi:10.1093/nar/gkae1186.
Jiarui Ding, Xian Adiconis, Sean K. Simmons, Monika S. Kowalczyk, Cynthia C. Hession, Nemanja D. Marjanovic, Travis K. Hughes, Marc H. Wadsworth, Tyler Burks, Lan T. Nguyen, John Y. H. Kwon, Boaz Barak, William Ge, Amanda J. Kedaigle, Shaina Carroll, Shuqiang Li, Nir Hacohen, Orit Rozenblatt-Rosen, Alex K. Shalek, Alexandra-Chloé Villani, Aviv Regev, and Joshua Z. Levin. Systematic comparison of single-cell and single-nucleus rna-sequencing methods. Nature Biotechnology, 38(6):737–746, Jun 2020. URL: https://doi.org/10.1038/s41587-020-0465-8, doi:10.1038/s41587-020-0465-8.
Fredrik Edfors, Frida Danielsson, Björn M Hallström, Lukas Käll, Emma Lundberg, Fredrik Pontén, Björn Forsström, and Mathias Uhlén. Gene-specific correlation of rna and protein levels in human cells and tissues. Molecular systems biology, 12(10):883, 2016.
Fluidigm. Single-cell analysis with microfluidics. https://www.fluidigm.com/area-of-interest/single-cell-analysis/single-cell-analysis-with-microfluidics, 2022. Accessed: 2022-05-07.
Ishaan Gupta, Paul G. Collier, Bettina Haase, Ahmed Mahfouz, Anoushka Joglekar, Taylor Floyd, Frank Koopmans, Ben Barres, August B. Smit, Steven A. Sloan, Wenjie Luo, Olivier Fedrigo, M. Elizabeth Ross, and Hagen U. Tilgner. Single-cell isoform rna sequencing characterizes isoforms in thousands of cerebellar cells. Nature Biotechnology, 36(12):1197–1202, Dec 2018. URL: https://doi.org/10.1038/nbt.4259, doi:10.1038/nbt.4259.
L E Hood, M W Hunkapiller, and L M Smith. Automated dna sequencing and analysis of the human genome. Genomics, 1(3):201–212, November 1987. URL: https://www.sciencedirect.com/science/article/abs/pii/0888754387900462, doi:10.1016/0888-7543(87)90046-2.
Radmila Hrdlickova, Masoud Toloue, and Bin Tian. Rna-seq methods for transcriptome analysis. WIREs RNA, 8(1):e1364, 2017. URL: https://wires.onlinelibrary.wiley.com/doi/abs/10.1002/wrna.1364, arXiv:https://wires.onlinelibrary.wiley.com/doi/pdf/10.1002/wrna.1364, doi:https://doi.org/10.1002/wrna.1364.
Saiful Islam, Amit Zeisel, Simon Joost, Gioele La Manno, Pawel Zajac, Maria Kasper, Peter Lönnerberg, and Sten Linnarsson. Quantitative single-cell rna-seq with unique molecular identifiers. Nature Methods, 11(2):163–166, Feb 2014. URL: https://doi.org/10.1038/nmeth.2772, doi:10.1038/nmeth.2772.
Miten Jain, Hugh E. Olsen, Benedict Paten, and Mark Akeson. The oxford nanopore minion: delivery of nanopore sequencing to the genomics community. Genome Biology, 17(1):239, Nov 2016. URL: https://doi.org/10.1186/s13059-016-1103-0, doi:10.1186/s13059-016-1103-0.
W. Min Jou, G. Haegeman, M. Ysebaert, and W. Fiers. Nucleotide sequence of the gene coding for the bacteriophage ms2 coat protein. Nature, 237(5350):82–88, May 1972. URL: https://doi.org/10.1038/237082a0, doi:10.1038/237082a0.
Teemu Kivioja, Anna Vähärautio, Kasper Karlsson, Martin Bonke, Martin Enge, Sten Linnarsson, and Jussi Taipale. Counting absolute numbers of molecules using unique molecular identifiers. Nature Methods, 9(1):72–74, Jan 2012. URL: https://doi.org/10.1038/nmeth.1778, doi:10.1038/nmeth.1778.
Allon M. Klein, Linas Mazutis, Ilke Akartuna, Naren Tallapragada, Adrian Veres, Victor Li, Leonid Peshkin, David A. Weitz, and Marc W. Kirschner. Droplet barcoding for single-cell transcriptomics applied to embryonic stem cells. Cell, 161(5):1187–1201, May 2015. PMC4441768[pmcid]. URL: https://doi.org/10.1016/j.cell.2015.04.044, doi:10.1016/j.cell.2015.04.044.
Suguna Rani Krishnaswami, Rashel V. Grindberg, Mark Novotny, Pratap Venepally, Benjamin Lacar, Kunal Bhutani, Sara B. Linker, Son Pham, Jennifer A. Erwin, Jeremy A. Miller, Rebecca Hodge, James K. McCarthy, Martijn Kelder, Jamison McCorrison, Brian D. Aevermann, Francisco Diez Fuertes, Richard H. Scheuermann, Jun Lee, Ed S. Lein, Nicholas Schork, Michael J. McConnell, Fred H. Gage, and Roger S. Lasken. Using single nuclei for rna-seq to capture the transcriptome of postmortem neurons. Nature Protocols, 11(3):499–524, Mar 2016. URL: https://doi.org/10.1038/nprot.2016.015, doi:10.1038/nprot.2016.015.
Atefeh Lafzi, Catia Moutinho, Simone Picelli, and Holger Heyn. Tutorial: guidelines for the experimental design of single-cell rna sequencing studies. Nature Protocols, 13(12):2742–2757, Dec 2018. URL: https://doi.org/10.1038/s41596-018-0073-y, doi:10.1038/s41596-018-0073-y.
Kevin Lebrigand, Virginie Magnone, Pascal Barbry, and Rainer Waldmann. High throughput error corrected nanopore single cell transcriptome sequencing. Nature Communications, 11(1):4025, Aug 2020. URL: https://doi.org/10.1038/s41467-020-17800-6, doi:10.1038/s41467-020-17800-6.
Yeon Lee and Donald C Rio. Mechanisms and regulation of alternative pre-mrna splicing. Annual review of biochemistry, 84(1):291–323, 2015. doi:10.1146/annurev-biochem-060614-034316.
Jingyi Jessica Li, Peter J Bickel, and Mark D Biggin. System wide analyses have underestimated protein abundances and the importance of transcription in mammals. PeerJ, 2:e270, 2014. doi:10.7717/peerj.270.
Glennis A Logsdon, Mitchell R Vollger, and Evan E Eichler. Long-read human genome sequencing and its applications. Nature Reviews Genetics, 21(10):597–614, 2020. doi:10.1038/s41576-020-0236-x.
Michael Love. Deseq2: rna-seq and negative binomial distribution. https://support.bioconductor.org/p/74572/, 2015. Accessed: 2025-05-18.
Evan Z. Macosko, Anindita Basu, Rahul Satija, James Nemesh, Karthik Shekhar, Melissa Goldman, Itay Tirosh, Allison R. Bialas, Nolan Kamitaki, Emily M. Martersteck, John J. Trombetta, David A. Weitz, Joshua R. Sanes, Alex K. Shalek, Aviv Regev, and Steven A. McCarroll. Highly parallel genome-wide expression profiling of individual cells using nanoliter droplets. Cell, 161(5):1202–1214, May 2015. URL: https://doi.org/10.1016/j.cell.2015.05.002, doi:10.1016/j.cell.2015.05.002.
Elisabetta Mereu, Atefeh Lafzi, Catia Moutinho, Christoph Ziegenhain, Davis J. McCarthy, Adrián Álvarez-Varela, Eduard Batlle, Sagar, Dominic Grün, Julia K. Lau, Stéphane C. Boutet, Chad Sanada, Aik Ooi, Robert C. Jones, Kelly Kaihara, Chris Brampton, Yasha Talaga, Yohei Sasagawa, Kaori Tanaka, Tetsutaro Hayashi, Caroline Braeuning, Cornelius Fischer, Sascha Sauer, Timo Trefzer, Christian Conrad, Xian Adiconis, Lan T. Nguyen, Aviv Regev, Joshua Z. Levin, Swati Parekh, Aleksandar Janjic, Lucas E. Wange, Johannes W. Bagnoli, Wolfgang Enard, Marta Gut, Rickard Sandberg, Itoshi Nikaido, Ivo Gut, Oliver Stegle, and Holger Heyn. Benchmarking single-cell rna-sequencing protocols for cell atlas projects. Nature Biotechnology, 38(6):747–755, Jun 2020. URL: https://doi.org/10.1038/s41587-020-0469-4, doi:10.1038/s41587-020-0469-4.
Ron Milo. What is the total number of protein molecules per cell volume? a call to rethink some published values. Bioessays, 35(12):1050–1055, 2013. URL: https://onlinelibrary.wiley.com/doi/10.1002/bies.201300066, doi:10.1002/bies.201300066.
Alexander F Palazzo and Eliza S Lee. Non-coding rna: what is functional and what is junk? Frontiers in genetics, 6:2, 2015. doi:10.3389/fgene.2015.00002.
Mihaela Pertea and Steven L Salzberg. Between a chicken and a grape: estimating the number of human genes. Genome biology, 11:1–7, 2010. URL: https://genomebiology.biomedcentral.com/articles/10.1186/gb-2010-11-5-206, doi:10.1186/gb-2010-11-5-206.
Martin Philpott, Jonathan Watson, Anjan Thakurta, Tom Brown, Udo Oppermann, and Adam P. Cribbs. Nanopore sequencing of single-cell transcriptomes with sccolor-seq. Nature Biotechnology, 39(12):1517–1520, Dec 2021. URL: https://doi.org/10.1038/s41587-021-00965-w, doi:10.1038/s41587-021-00965-w.
Xu Ren and Pei-Fen Kuan. Negative binomial additive model for rna-seq data analysis. BMC bioinformatics, 21:1–15, 2020.
Roche. Sequencing by expansion (sbx) technology. https://sequencing.roche.com/global/en/article-listing/sequencing-platform-technologies.html, 2025. Accessed: 2025-05-11.
Mandeep Singh, Ghamdan Al-Eryani, Shaun Carswell, James M. Ferguson, James Blackburn, Kirston Barton, Daniel Roden, Fabio Luciani, Tri Giang Phan, Simon Junankar, Katherine Jackson, Christopher C. Goodnow, Martin A. Smith, and Alexander Swarbrick. High-throughput targeted long-read single cell sequencing reveals the clonal and transcriptional landscape of lymphocytes. Nature Communications, 10(1):3120, Jul 2019. URL: https://doi.org/10.1038/s41467-019-11049-4, doi:10.1038/s41467-019-11049-4.
David M Suter, Nacho Molina, David Gatfield, Kim Schneider, Ueli Schibler, and Felix Naef. Mammalian genes are transcribed with widely different bursting kinetics. science, 332(6028):472–474, 2011. URL: https://www.science.org/doi/10.1126/science.1198817, doi:10.1126/science.1198817.
Valentine Svensson, Kedar Nath Natarajan, Lam-Ha Ly, Ricardo J. Miragaia, Charlotte Labalette, Iain C. Macaulay, Ana Cvejic, and Sarah A. Teichmann. Power analysis of single-cell rna-sequencing experiments. Nature Methods, 14(4):381–387, Apr 2017. URL: https://doi.org/10.1038/nmeth.4220, doi:10.1038/nmeth.4220.
Bosiljka Tasic, Zizhen Yao, Lucas T. Graybuck, Kimberly A. Smith, Thuc Nghi Nguyen, Darren Bertagnolli, Jeff Goldy, Emma Garren, Michael N. Economo, Sarada Viswanathan, Osnat Penn, Trygve Bakken, Vilas Menon, Jeremy Miller, Olivia Fong, Karla E. Hirokawa, Kanan Lathia, Christine Rimorin, Michael Tieu, Rachael Larsen, Tamara Casper, Eliza Barkan, Matthew Kroll, Sheana Parry, Nadiya V. Shapovalova, Daniel Hirschstein, Julie Pendergraft, Heather A. Sullivan, Tae Kyung Kim, Aaron Szafer, Nick Dee, Peter Groblewski, Ian Wickersham, Ali Cetin, Julie A. Harris, Boaz P. Levi, Susan M. Sunkin, Linda Madisen, Tanya L. Daigle, Loren Looger, Amy Bernard, John Phillips, Ed Lein, Michael Hawrylycz, Karel Svoboda, Allan R. Jones, Christof Koch, and Hongkui Zeng. Shared and distinct transcriptomic cell types across neocortical areas. Nature, 563(7729):72–78, Nov 2018. URL: https://doi.org/10.1038/s41586-018-0654-5, doi:10.1038/s41586-018-0654-5.
Amandine Vanhoutteghem and Philippe Djian. The human basonuclin 2 gene has the potential to generate nearly 90,000 mrna isoforms encoding over 2000 different proteins. Genomics, 89(1):44–58, 2007. URL: https://www.sciencedirect.com/science/article/pii/S0888754306002072, doi:10.1016/j.ygeno.2006.07.006.
Victor E Velculescu, Stephen L Madden, Lin Zhang, Alex E Lash, Jian Yu, Carlo Rago, Anita Lal, Clarence J Wang, Gary A Beaudry, Kristin M Ciriello, and others. Analysis of human transcriptomes. Nature genetics, 23(4):387–388, 1999. URL: https://www.nature.com/articles/ng1299_387b, doi:10.1038/70487.
Xiliang Wang, Yao He, Qiming Zhang, Xianwen Ren, and Zemin Zhang. Direct comparative analyses of 10x genomics chromium and smart-seq2. Genomics, Proteomics & Bioinformatics, 19(2):253–266, 2021. Single-cell Omics Analysis. URL: https://www.sciencedirect.com/science/article/pii/S1672022921000486, doi:https://doi.org/10.1016/j.gpb.2020.02.005.
Xiannian Zhang, Tianqi Li, Feng Liu, Yaqi Chen, Jiacheng Yao, Zeyao Li, Yanyi Huang, and Jianbin Wang. Comparative analysis of droplet-based ultra-high-throughput single-cell rna-seq systems. Molecular Cell, 73(1):130–142.e5, Jan 2019. URL: https://doi.org/10.1016/j.molcel.2018.10.020, doi:10.1016/j.molcel.2018.10.020.
Grace X. Y. Zheng, Jessica M. Terry, Phillip Belgrader, Paul Ryvkin, Zachary W. Bent, Ryan Wilson, Solongo B. Ziraldo, Tobias D. Wheeler, Geoff P. McDermott, Junjie Zhu, Mark T. Gregory, Joe Shuga, Luz Montesclaros, Jason G. Underwood, Donald A. Masquelier, Stefanie Y. Nishimura, Michael Schnall-Levin, Paul W. Wyatt, Christopher M. Hindson, Rajiv Bharadwaj, Alexander Wong, Kevin D. Ness, Lan W. Beppu, H. Joachim Deeg, Christopher McFarland, Keith R. Loeb, William J. Valente, Nolan G. Ericson, Emily A. Stevens, Jerald P. Radich, Tarjei S. Mikkelsen, Benjamin J. Hindson, and Jason H. Bielas. Massively parallel digital transcriptional profiling of single cells. Nature Communications, 8(1):14049, Jan 2017. URL: https://doi.org/10.1038/ncomms14049, doi:10.1038/ncomms14049.
Christoph Ziegenhain, Beate Vieth, Swati Parekh, Björn Reinius, Amy Guillaumet-Adkins, Martha Smets, Heinrich Leonhardt, Holger Heyn, Ines Hellmann, and Wolfgang Enard. Comparative analysis of single-cell rna sequencing methods. Mol Cell, 65(4):631–643.e4, February 2017. URL: https://www.cell.com/molecular-cell/fulltext/S1097-2765(17)30049-7, doi:10.1016/j.molcel.2017.01.023.
2.7. Contributors#
We gratefully acknowledge the contributions of:
2.7.2. Reviewers#
Yuexin Chen