28. Single-cell data resolved in space#
Key takeaways
Spatially resolved genomics technologies enable the measurement of genome-scale omics data while preserving spatial context, offering multi-cell, single-cell, and sub-cellular resolution to address diverse biological questions.
28.1. Motivation#
Bulk and single-cell genomic technologies enabled us to characterize and understand cellular identities and their dependencies on genome scale. Up to this point, all single-cell technologies described in this work characterized dissociated cells that were removed from the sample of interest. However, by removing the spatial context of the cells and their molecules, one also loses the spatial context which is an essential component for many biological questions. Spatially resolved genomics resolve this issue by measuring both genome-scale omics and preserving the spatial information.
28.2. Overview of spatial profiling measurements#
Spatially resolved genomics can be measured with various technologies that quantify the transcriptome, proteome or chromatin accessibility. However, these technologies vary in terms of scale, resolution, sensitivity, multiplexing and applicability. As the landscape of spatially resolved genomics is developing fast and is expected to change massively in the next few years, we are introducing only three overall groups of spatial omics technologies based on their capturing resolution. Additional information can be obtained through the linked reviews and papers following this introduction. [Moffitt et al., 2022] [Walker et al., 2022] [Yue et al., 2023]
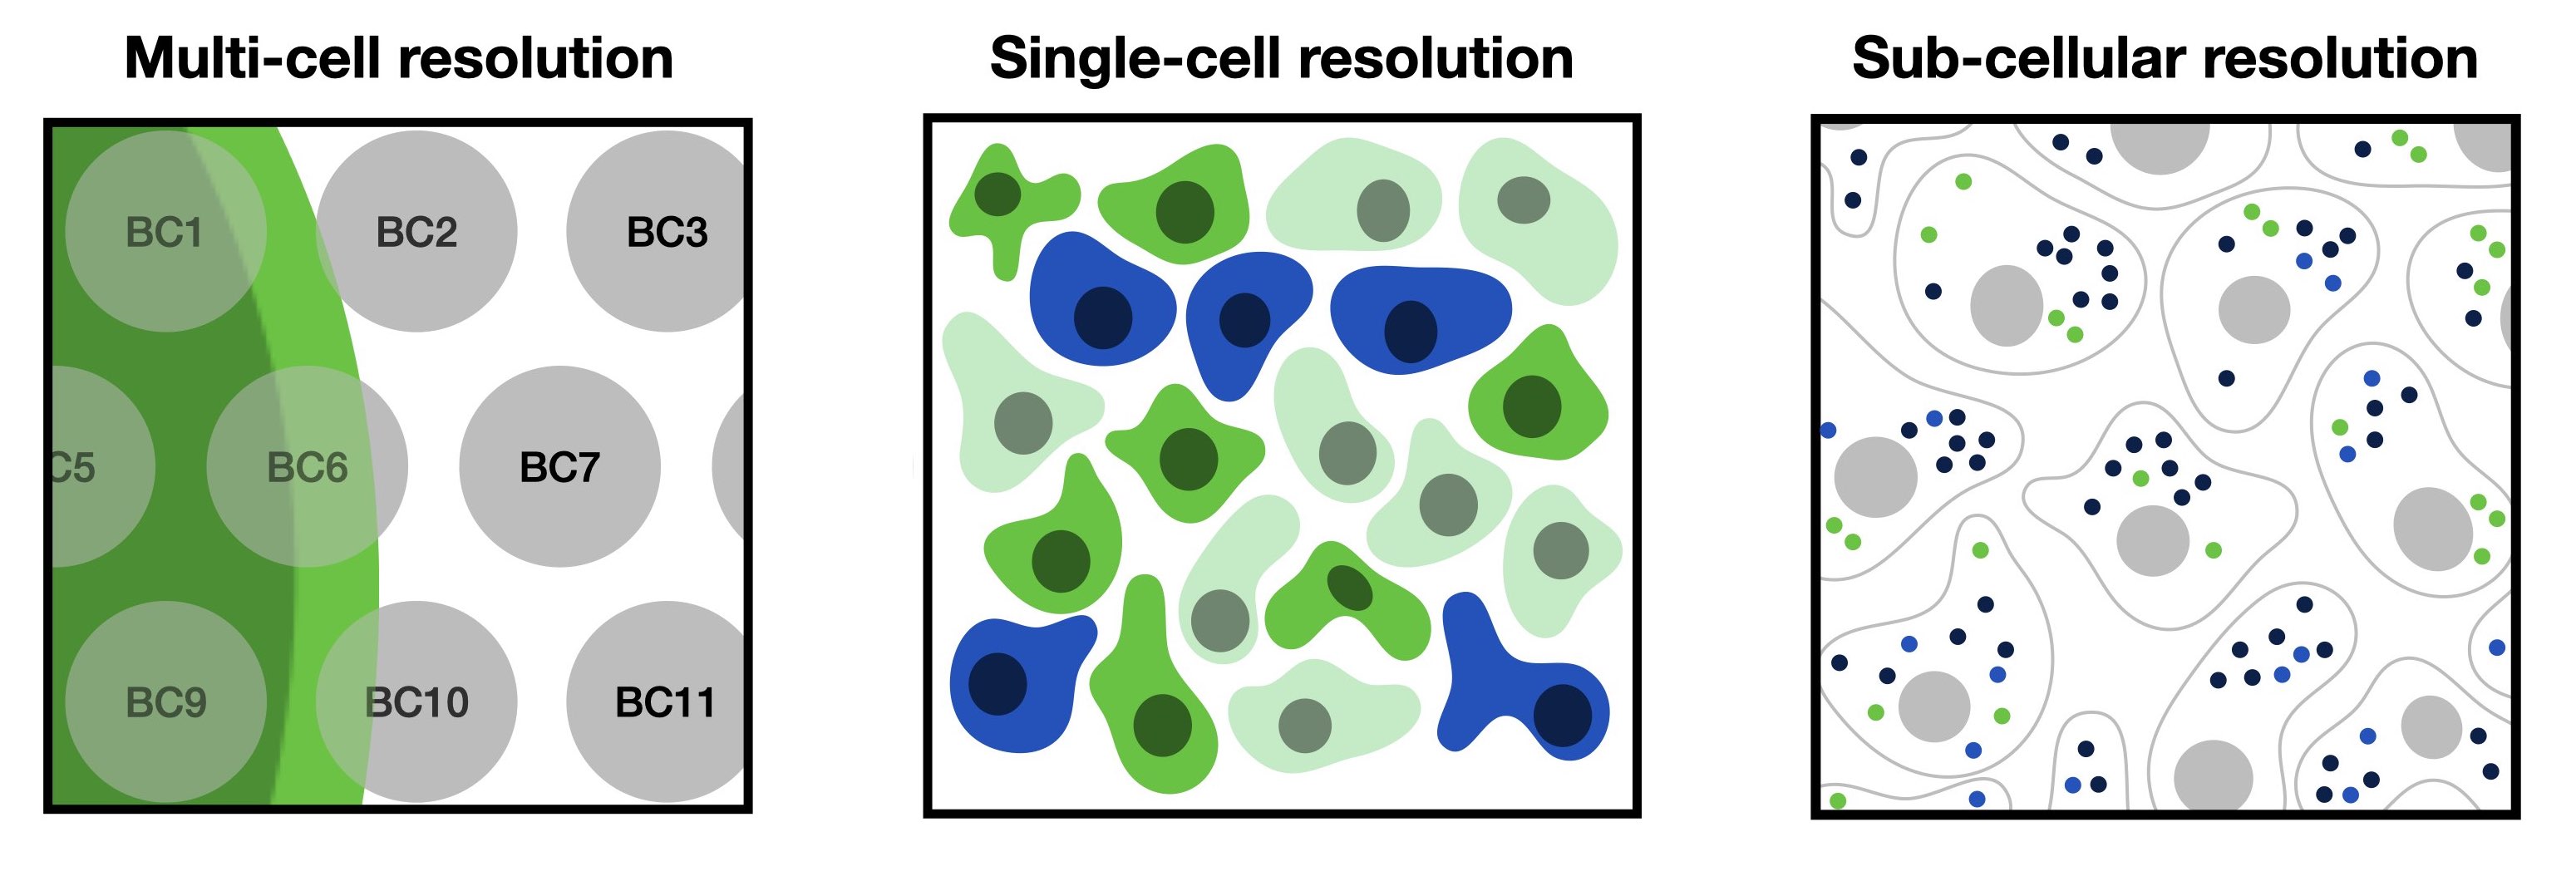
Fig. 28.1 Spatially resolved genomics data varies in resolution from multi-cell, single-cell to sub-cellular resolution.#
Broadly spoken, one can differentiate spatially resolved genomics into technologies that measure at multi-cell, single-cell and sub-cellular resolution. We will shortly motivate each of those scales and highlight their advantages and challenges and introduce the reader to a few technologies that fall into the respective category.
28.2.1. Multi-cell resolution#
Spatial omics data obtained at multi-cell resolution typically captures omics measurements among several cells. So, each datapoint contains information from a varying number of cells and also potentially different cell types. Multi-cell resolution data can be decomposed with deconvolution methods to obtain proportions of different cells or cell types per spot.
Multi-cell resolution data typically capture transcriptome-wide gene expression profiles at varying resolution. The obtained resolution for spot-based technologies varies between 55um (Visium) to 10 um (slide-seq). A widely known, commercially available and successful technology is Visium provided by 10x Genomics. We will showcase how to analyze and deconvolve Visium data in the tutorials.
28.2.2. Single-cell resolution#
Spatial omics data obtained at single-cell resolution either directly capture single cells at their exact position or capture spots on the scale of single-cell. Examples for spot-based methods are HDST, slide-seqV2 or stereo-seq. These methods capture the whole transcriptome but still have a low capture efficiency.
Targeted methods provide an alternative for measuring cells at their exact position. Common examples are MERFISH, seqFISH+, IMC or multiplexed IHC (e.g. cyCIF and CODEX). These technologies are usually expensive and only measure a limited features space. These methods do not capture spots at a predefined location or grid, but measure individual transcript or cellular locations.
28.2.3. Sub-cellular resolution#
Spatial omics data at sub-cellular resolution captures the position of individual RNA molecules. Those positions can either be captured through single-molecule imaging or via spatial barcoding with spot-sizes smaller than single-cells. By performing cell segmentation on sub-cellular data one can obtain single-cell resolution data where expression is aggregated to cell-wise measurements which than can be processed in spatially-aware analysis pipelines. We will show how to perform this analysis for a MERFISH dataset.
28.2.4. Recommended reading#
To get a more elaborate understanding of the differences between the spatial experimental assays we recommend the following papers:
The emerging landscape of spatial profiling technologies [Moffitt et al., 2022]
Deciphering tissue structure and function using spatial transcriptomics [Walker et al., 2022]
A guidebook of spatial transcriptomic technologies, data resources and analysis approaches [Yue et al., 2023]
28.3. References#
Jeffrey R. Moffitt, Emma Lundberg, and Holger Heyn. The emerging landscape of spatial profiling technologies. Nature Reviews Genetics, 23(12):741–759, December 2022. URL: https://doi.org/10.1038/s41576-022-00515-3, doi:10.1038/s41576-022-00515-3.
Benjamin L. Walker, Zixuan Cang, Honglei Ren, Eric Bourgain-Chang, and Qing Nie. Deciphering tissue structure and function using spatial transcriptomics. Communications Biology, 5(1):220, March 2022. URL: https://doi.org/10.1038/s42003-022-03175-5, doi:10.1038/s42003-022-03175-5.
Liangchen Yue, Feng Liu, Jiongsong Hu, Pin Yang, Yuxiang Wang, Junguo Dong, Wenjie Shu, Xingxu Huang, and Shengqi Wang. A guidebook of spatial transcriptomic technologies, data resources and analysis approaches. Computational and Structural Biotechnology Journal, 21:940–955, 2023. URL: https://www.sciencedirect.com/science/article/pii/S2001037023000156, doi:https://doi.org/10.1016/j.csbj.2023.01.016.
28.4. Contributors#
28.4.2. Reviewers#
Lukas Heumos